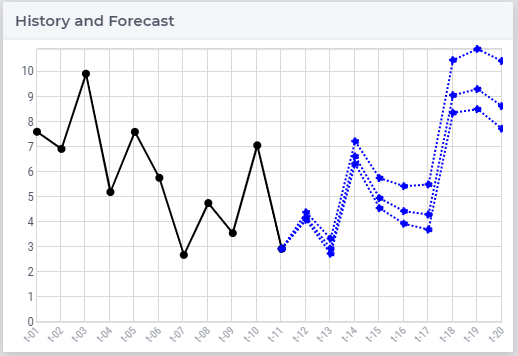
I have a parameter over weeks with historic and forecast info. I want the historical week to be a dotted line and from the current week onwards a solid line. I use an annotation ‘dash’ and created a string parameter that have dash for the historic weeks. I added this as annotation the parameter, but if I use this all the weeks are dotted. (When I remove the annotation the whole is solid, as it should be).
So is it possible to change the line over the axis?
Best answer by Gertjan
View original