Solved

How to visialize a 'stock' line graph

  • 1 October 2020
  • 6 replies
  • 119 views

Userlevel 1
Badge +4

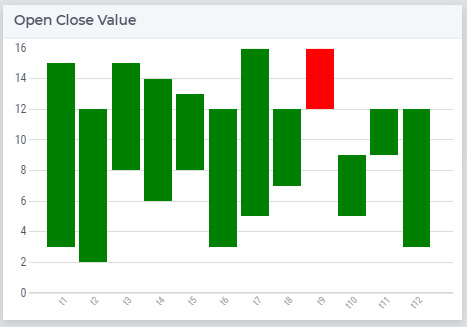
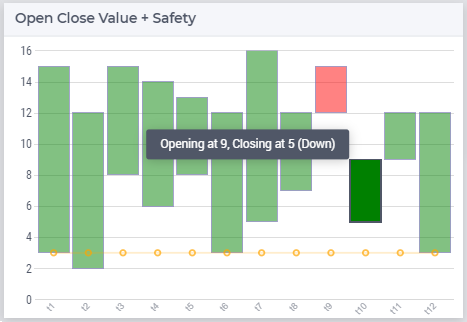
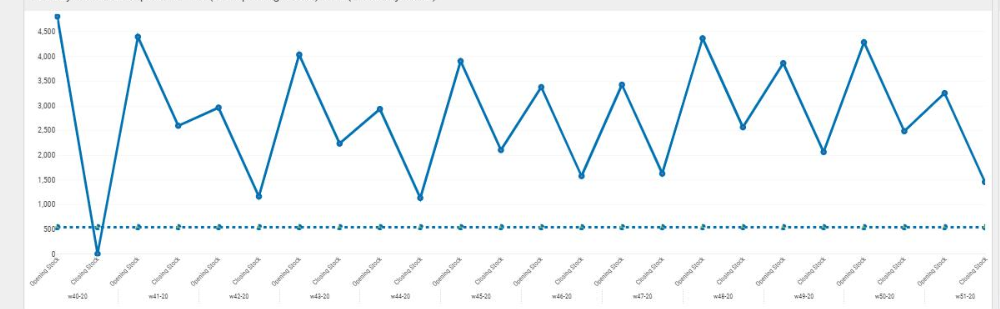
I would like to visualize the opening and end stock in one line. This means for example

Opening Stock Week 1: 100 (t = 1)

End Stock Week 1: 80 (t = 2)

Opening Stock Week 2: 120. (t = 2)


This means on the x-axis (t = 2) has 2 values 80 and 120. I would like to see this jump without creating dummy x-axis points which are very close to t = 2.

Is this possible?

icon

Best answer by Gertjan 5 October 2020, 17:12

View original

6 replies

Userlevel 1
Badge +4

Thanks Gertjan, for your suggestion. For now we wait for 4.76 and then decide if we want to move forwards using the combination of the bar and line chart. 

Userlevel 6
Badge +6

@Marc Wingender

Maybe you can also use the Bar Chart to display the difference per period. If it’s not (like in example) always 1-directional (going down), you could use color coding for each direction.

This is a stacked bar-chart where I made the base transparent (‘Closing Stock’ value in your example) and calculated the difference between ‘Opening’ and ‘Closing’. 

Soon we’ll add the line option allowing you to add e.g. a safety stock line. 

High Low chart using the Bar Chart
High Low chart using the upcoming Bar-Line Chart


For bar-line chart, see also: https://community.aimms.com/share-your-product-ideas-37/can-we-have-a-barchart-linechart-in-the-same-chart-311?postid=1912#post1912

Userlevel 1
Badge +4

This is an visualisaition of the stock graph now…

The dotted straight line is the safety stock

Userlevel 6
Badge +6

Hi @Marc Wingender ,

Can you share a visual/screen-capture of the result? As we do not have such a stock chart in stock, so curious to see how the suggestion of @gdiepen plays out for you. Can imagine others love to see it as well.

Thanks in advance.

Userlevel 1
Badge +4

Thanks Guido for your suggestion.

It is not the full solution yet, but this option visualizes the best so far

Userlevel 5
Badge +7

Not sure if it would work for you, but if you create a parameter that is two dimensional:


pStockLevel( iPeriod, iOpeningOrClose )


where the second index is just an index for set with opening and close elements, you could put period and openingclose on the x-axis. However, they will be evenly spaced, not sure if that is what you want

Reply


Didn't find what you were looking for? Try searching on our documentation pages:

AIMMS Developer & PRO | AIMMS How-To | AIMMS SC Navigator