

I want visualize stock levels with their respective safety stock level. I have 2 parameters running over products and weeks. See below.
The bar is good, but the lines are connected insead of different per product.
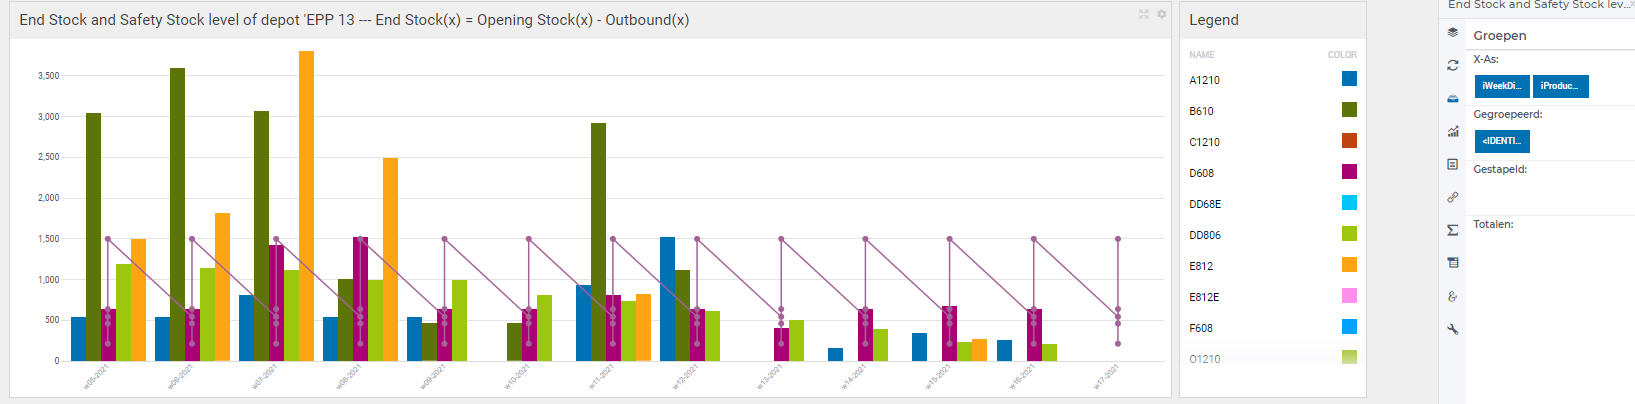
Is there a way to fix this?

I want visualize stock levels with their respective safety stock level. I have 2 parameters running over products and weeks. See below.
The bar is good, but the lines are connected insead of different per product.
Is there a way to fix this?
Best answer by mohansx
The current iteration of the bar-line widget supports only identifiers with 1 index and you are trying to visualize 2-d identifiers.
Already have an account? Login
Please use your business or academic e-mail address to register
No account yet? Create an account
Enter your E-mail address. We'll send you an e-mail with instructions to reset your password.
Didn't find what you were looking for? Try searching on our documentation pages: