Hi.
I am trying to plot a pie chart in a user interface. The colors repeat for different pie sections as can be seen in the attached image. How do I set different colors for different pie sections. Thanks.

Hi.
I am trying to plot a pie chart in a user interface. The colors repeat for different pie sections as can be seen in the attached image. How do I set different colors for different pie sections. Thanks.
Hi
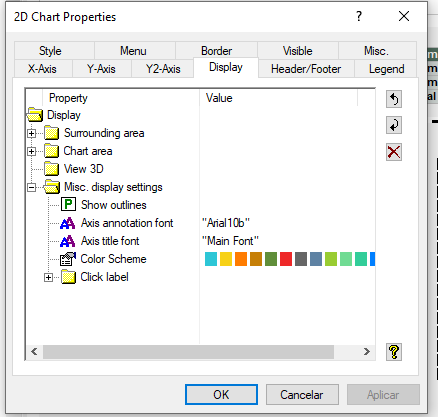
I’m assuming you are using 2D chart object - type “pie”.
On its properties, under “display”, you can set a color scheme created by you:
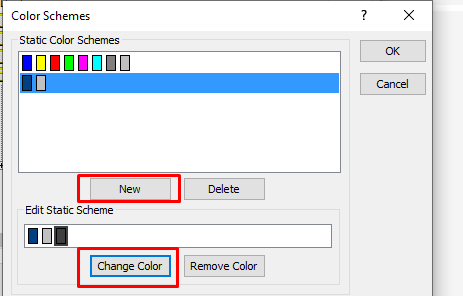
You can create a new scheme color by color using “New” and “Change Color” buttons:
Or you can work with subsets, like I did here:
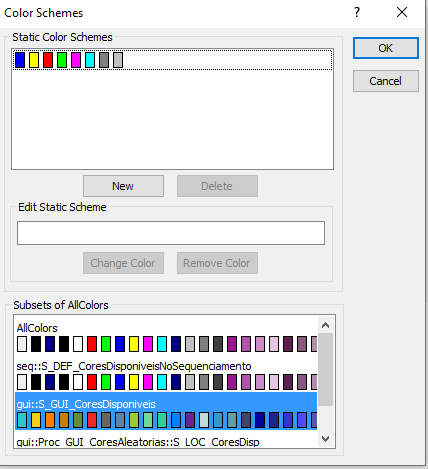
I’m using a set created by me, called “S_GUI_CoresDisponiveis”:
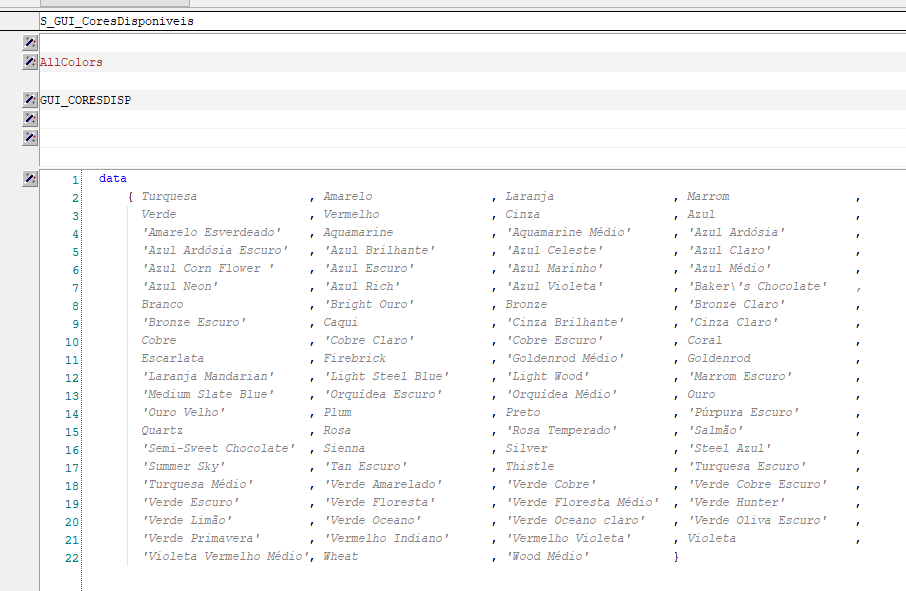
And these colors, I think I might have created using “User Color” tool:
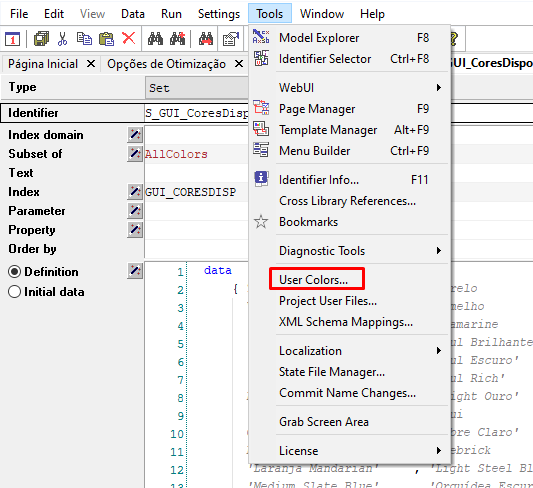
Hope it helps!
This is very detailed!! Thanks, Mateus.
Already have an account? Login
Please use your business or academic e-mail address to register
No account yet? Create an account
Enter your E-mail address. We'll send you an e-mail with instructions to reset your password.
Didn't find what you were looking for? Try searching on our documentation pages: