Hi,
i want to visualize the frequency of postcodes from a table with a barchart,
but I didnt have any ideas how to do this. Can somebody help?
Thanks

Hi,
i want to visualize the frequency of postcodes from a table with a barchart,
but I didnt have any ideas how to do this. Can somebody help?
Thanks
Hi,
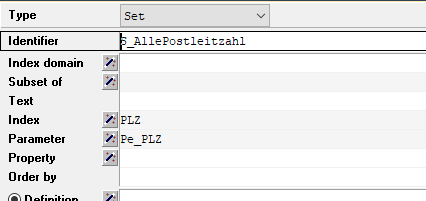
I would create a set called S_AllePostleitzahlen with attributes ‘Index’ set to “PLZ” and ‘Parameter’ set to “Pe_PLZ”:
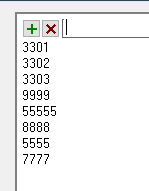
Then I would populate this set with all possible PLZ:
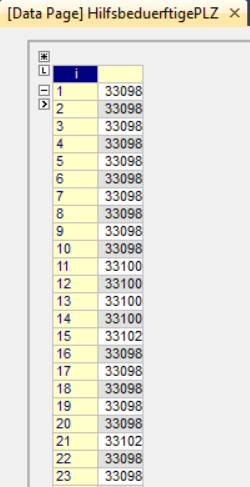
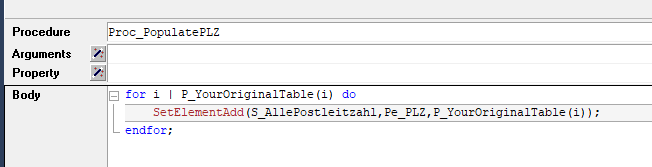
Remark: you can also populate it easily with every PLZ that has frequency >= 1 using your original table Hilfsbeduerftige(i), that I named P_YourOriginalTable(i,) using a procedure:
After that, I would create a parameter P_PostleitzahlHaufigkeit(PLZ) that counts the PLZ frequency:
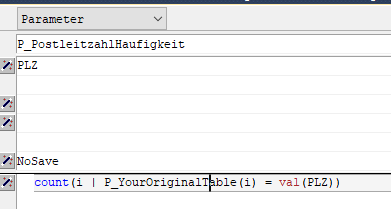
and then you can use this parameter (P_PostleitzahlHaufigkeit(PLZ)) directly on the barchart object.
Idk if it’s the best approach but it works. Hope it helps!
Thank you for your fast response, you helped me a lot.
Hi
Already have an account? Login
Please use your business or academic e-mail address to register
No account yet? Create an account
Enter your E-mail address. We'll send you an e-mail with instructions to reset your password.
Didn't find what you were looking for? Try searching on our documentation pages: