Hello,
I have created two histograms using "Histogramcreate" where the "HistogramSetDomain" are the same but the frequencies observed (using "HistogramGetFrequencies") are different. I have also drew the plots of the histograms separately. I am wondering if it is possible to show the two frequency histograms on the same plot?
I appreciate any help in advance

Solved
how to draw 2 frequency histograms on the same plot
Best answer by deannezhang
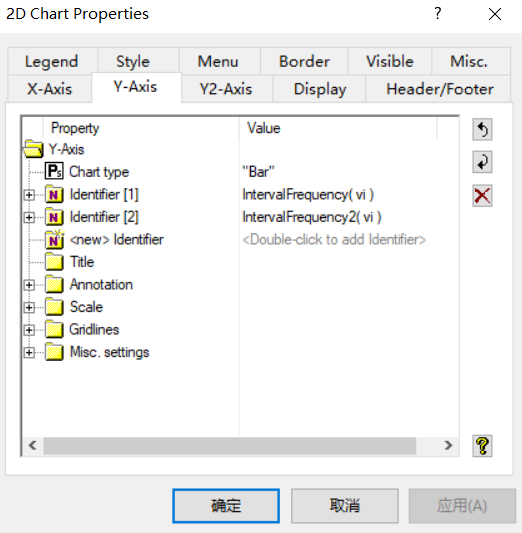
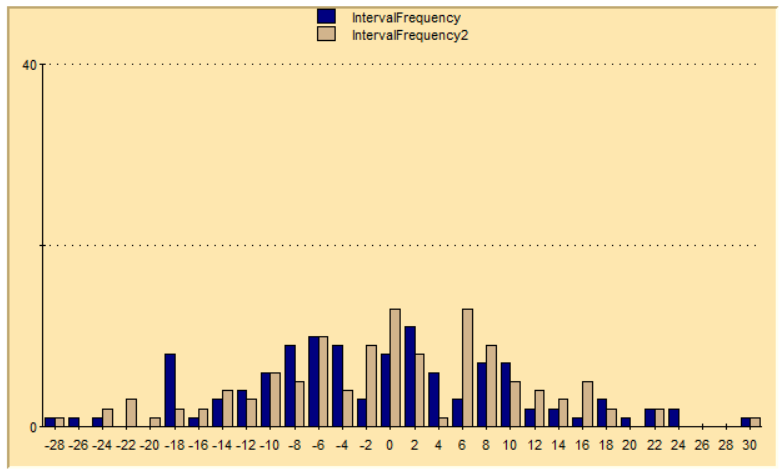
There is no problem you can put them in the same plot. If you use a 2-D chart to plot them, you can put both of the frequencies in the Y-Axis.

Sign up
Already have an account? Login
Please use your business or academic e-mail address to register
Login to the community
No account yet? Create an account
Enter your E-mail address. We'll send you an e-mail with instructions to reset your password.