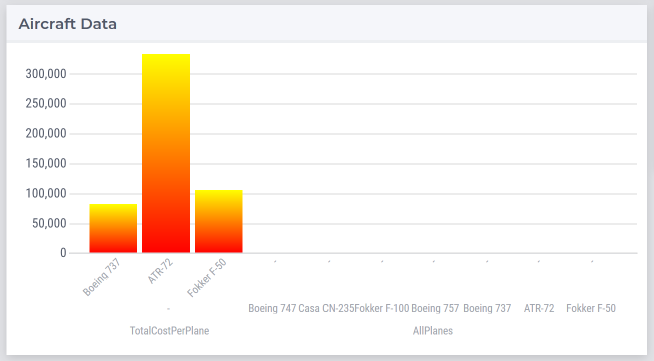
I know how to use CSS to change the color of a bar in AIMMS;
@color19-1: #808dc2;
.mixin-color(color19-1; @color19-1);
And in this way I can use “color-19-1” to set my bar for example to green or red.
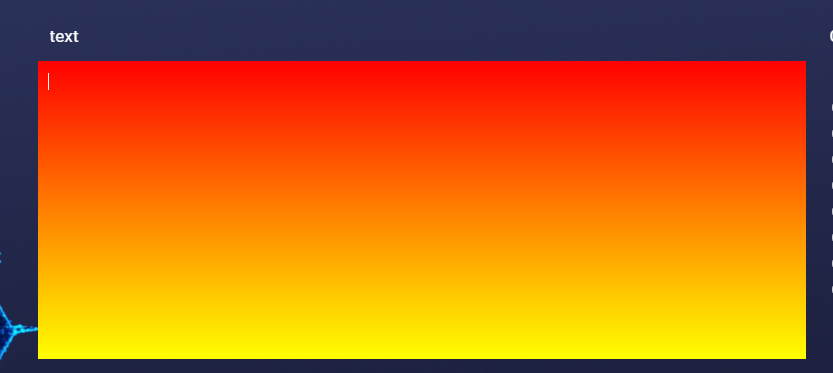
Is there a way to use a gradient to color the bar? It is working for he background of a widget. But when I try the same logic on a bar in a chart it gets the default color.
background-image: linear-gradient(red, yellow);
Best answer by Edo Nijmeijer
You’re welcome, of course.
And since my newest suggested work-around was also not very straight-forward, I bring it here immediately anyway. For any other readers: please don’t use this method to insert anything else into your pages.
Step 1: add a .js file to the resources/js folder of your model. Example content with three example gradients:
svgContainer.innerHTML = contents; svgContainer.setAttribute("viewbox", "0 0 0 0"); reWritableContainer.setAttribute("style", "display: block; position: absolute; width: 0; height: 0"); reWritableContainer.append(svgContainer); document.body.insertBefore(reWritableContainer, document.body.children[0]); // This is really a very, very convoluted way of getting the browser to actually acknowledge this svg for re-use later on. // But it turns out to be needed, without also damaging the rest of the page reWritableContainer.innerHTML = reWritableContainer.innerHTML;
Step 2: add a .css file to the resources/css folder, with a suitable css defintion for your chart element, referering to the id of the definition inserted by the script
[edited after some unresourceful trying to do this myself]
I’m afraid I have to invalidate my answer below this ‘edit’. It does not work.
I tried it, on end, but the main problem comes from not being capable of getting access to the gradient definitions in the separate .svg file.
So yes, you can load the svg by putting it in an Image widget, but being an external file, the browser will not propagate the definitions to svg elements that are part of the main document, where the bar chart actually is.
It only works if the code for the svg is part of the document itself. To which you normally don’t have (and should not need to have) access.
Dirty work-around that I would not recommend (not just for the sake of gradients): include a javascript file that actually inserts the needed svg-definition into the page, in a location where you don’t see it.
If you really feel like that work-around might serve you, I’m glad to assist you if needed. Otherwise, for now, gradients are sort of out of the question. Sorry.
[/edit]
Hi Olmo,
Your question actually marks in import difference between styling regular parts of the webUI interface and styling parts of (most) charts.
Because charts actually consist of SVG elements (Scalable Vector Graphics), as opposed the regular interface elements which are ‘just’ HTML elements.
Both can be styled through CSS, as you’ve been doing, but some attributes are different or accept different values for apparently similar visual results. One of which is the fill attribute, when it comes to anything else than a solid color.
SVG Gradients are actually a separate object/definition. The fill attribute will need to refer to this object, instead of being able to specifiy it directly as a complete value (like for html elements, in your example).
That brings us to what I think could support your idea: include a .SVG file in your resources folder, containing the following code:
See how the css references the id of the definition of the linear gradient in the svg file? This should work (but haven’t tried it here, right now, I must admit).
For more ideas on svg gradients, see for example MDN.
And you could also use css variables to make the svg definition of the gradient a bit less static, starting with the ideas found here
And since my newest suggested work-around was also not very straight-forward, I bring it here immediately anyway. For any other readers: please don’t use this method to insert anything else into your pages.
Step 1: add a .js file to the resources/js folder of your model. Example content with three example gradients:
svgContainer.innerHTML = contents; svgContainer.setAttribute("viewbox", "0 0 0 0"); reWritableContainer.setAttribute("style", "display: block; position: absolute; width: 0; height: 0"); reWritableContainer.append(svgContainer); document.body.insertBefore(reWritableContainer, document.body.children[0]); // This is really a very, very convoluted way of getting the browser to actually acknowledge this svg for re-use later on. // But it turns out to be needed, without also damaging the rest of the page reWritableContainer.innerHTML = reWritableContainer.innerHTML;
Step 2: add a .css file to the resources/css folder, with a suitable css defintion for your chart element, referering to the id of the definition inserted by the script