how-to

How to Combine Bar Chart and Line Chart

  • 21 December 2019
  • 4 replies
  • 311 views
How to Combine Bar Chart and Line Chart
Userlevel 6
Badge +6

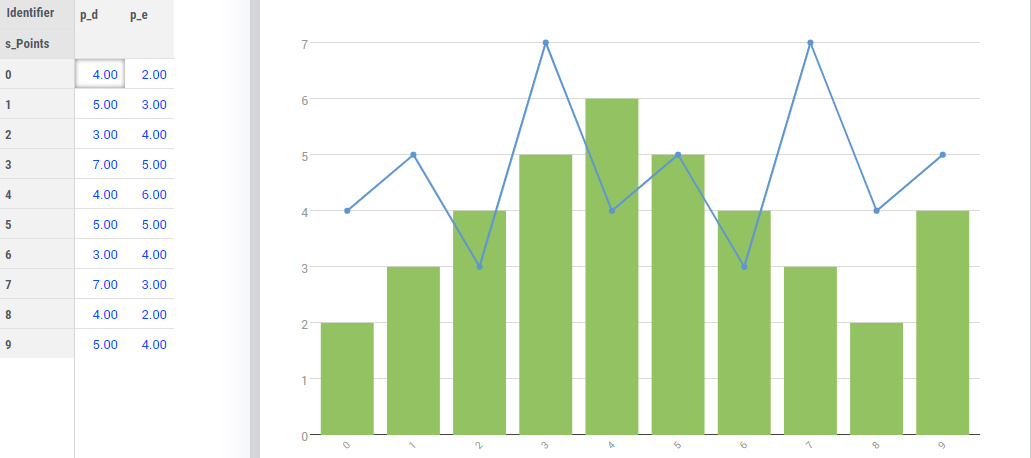
Sometimes you may want to combine a bar and linechart in one widget. We’ll call this a “blinechart.”


The blinechart is not a supported feature, so this handy tip is provided “as is”. It is an example of how to use Application Specific Resources (ASR).


This widget has a number of assumptions regarding the data, and a couple of configurations as outlined below.


Read more...


This topic has been closed for comments

4 replies

Hi @Jess Es,

Can I use a webui::ElementTextIdentifier in this chart?

Userlevel 6
Badge +6

This being a ‘plotly’ chart added as an Application Specific Resource, it does not align with the standards options we offer for charts unfortunately. Hence look & feel and some behavior is missing (e.g. tooltips configuration, store focus).

Userlevel 6
Badge +6

FYI: Working on a native AIMMS widget. See https://community.aimms.com/share-your-product-ideas-37/can-we-have-a-barchart-linechart-in-the-same-chart-311?postid=1912#post1912

Userlevel 6
Badge +6

Now available in 4.76, with the native AIMMS features such as tooltip, elementtextidentifier etc.

Didn't find what you were looking for? Try searching on our documentation pages:

AIMMS Developer & PRO | AIMMS How-To | AIMMS SC Navigator