Dear community,
how can I make scatter plots in WebUI?
I appreciate any help in advance

Page 1 / 1
Hi
Hi
Was the answer provided able to help you with your question or were you able to find your own solution?
Thanks
Hi Gergerly,
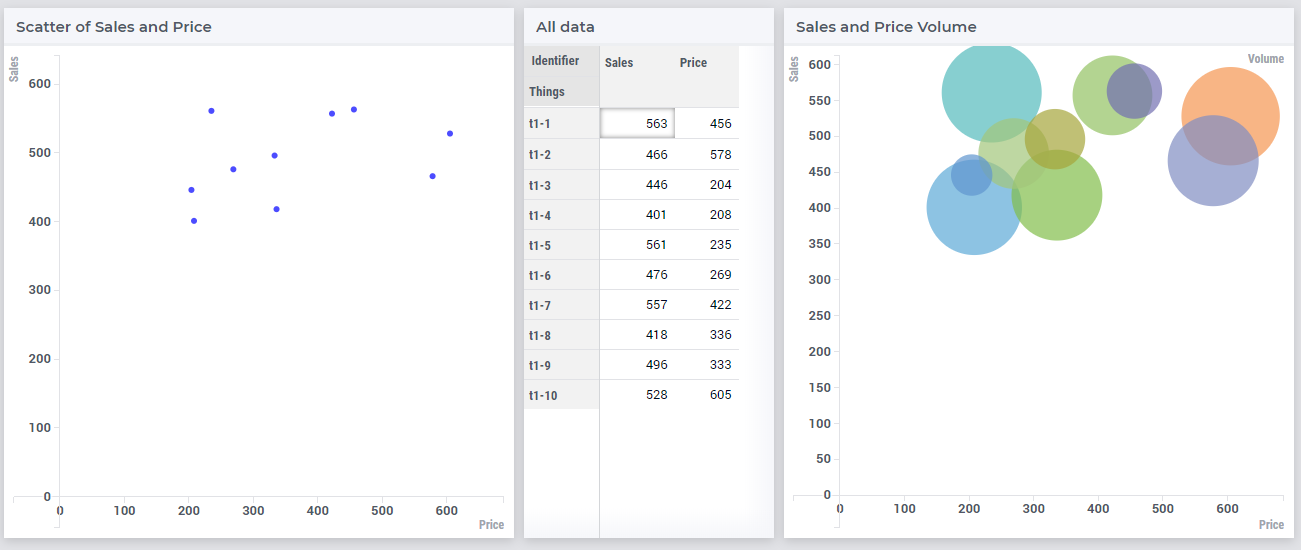
By default, the Bubble Chart takes a relative size (and a default size if all node sizes are the same). By adding a WebUI annotation to the node and using this to adjust the node-size for this specific set of nodes via Custom CSS, you can create a scatter plot.
Below you see the same info: Left as Scatter, Right as regular Volume Bubbles. I also attached the project where I added the following as custom css:
circle.annotation-scatter-plot.chart-item.bubble {
 r: 3px;
 fill: blue;
}
Enjoy
Thank you very much
Sign up
Already have an account? Login
Please use your business or academic e-mail address to register
Login to the community
No account yet? Create an account
Enter your E-mail address. We'll send you an e-mail with instructions to reset your password.