Solved

How to suppress default values using the display domain for a linechart

  • 24 April 2019
  • 1 reply
  • 85 views

Userlevel 4
Badge
  • AIMMS Implementation Partner
  • 57 replies
I understand from this AIMMS WebUI Manual entry that the display domain should default to suppressing default values. I also understand that using a value of 1 shows all values (and 0 shows no values).

But my graph is still plotting all the zero (default) values. For example, “Stranger” in this linechart has no values, but he still gets graphed.


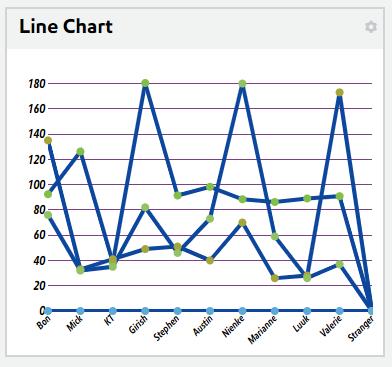
Am I misunderstanding something or is there a bug?

Thanks!
~Bon
icon

Best answer by Khang.Bui 24 April 2019, 21:05

View original

1 reply

Hi Bon,

The behavior you see here is indeed correct. For the line chart a single svg element is used which will draw out the entire plotted line values even if it contains those default values. Of course, if all the values were default this line wouldn't be drawn under normal circumstances.

So currently we cannot plot lines with interruptions but we do have this as a feature request already within our roadmap. I don't have an expected release date for this feature but there will likely be work put into its implementation sometime in the second half of this year.

Regards,
Khang

Reply


Didn't find what you were looking for? Try searching on our documentation pages:

AIMMS Developer & PRO | AIMMS How-To | AIMMS SC Navigator