Solved

How to visualize lines in a chart for two parameters with missing values?

  • 17 December 2021
  • 7 replies
  • 129 views

Badge +4
  • AIMMS Implementation Partner
  • 12 replies

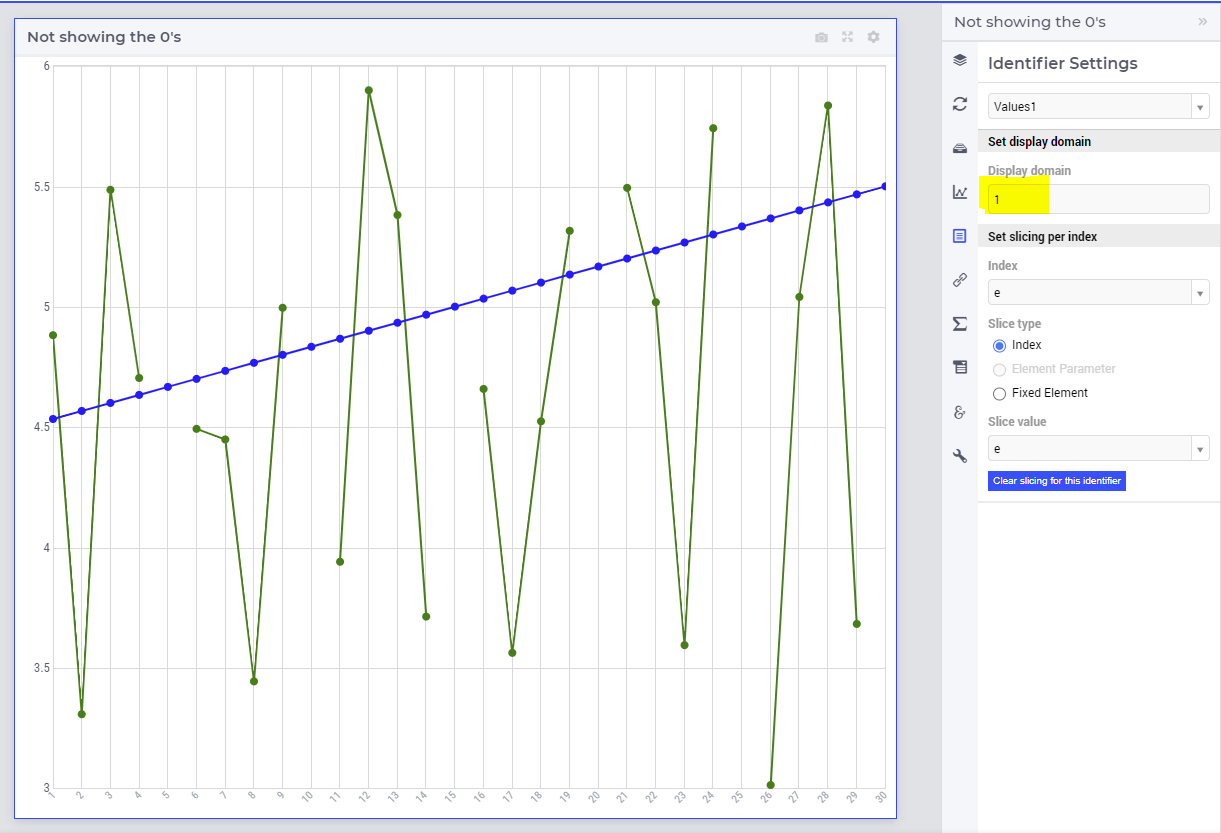
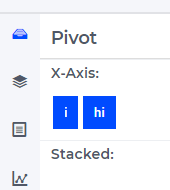
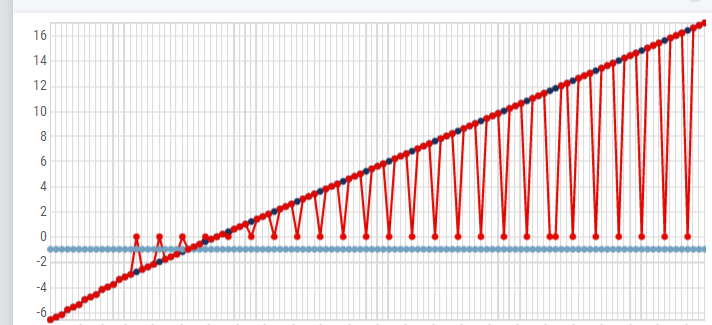
I tried to draw two lines in a graph for two different parameters, one of them has missing/null values and for some reason AIMMS then draws a line to zero (like in the picture below). How can I fix this?


icon

Best answer by Gertjan 23 December 2021, 12:56

View original

7 replies

Userlevel 3
Badge +5

@Brn HI,   

Does this documentation here https://documentation.aimms.com/webui/line-chart-widget.html#contents-and-pivoting help out?    

Also, can you share your model or an example model or your model/identifiers code snippet, so that we can try out the case and help you out.


Thanks, 

Madhu K

Userlevel 6
Badge +6

I suggest to work with a combination of the Domain Identifier (assuring that the parameter does not generate elements that contain a ‘0’ and assure that the line chart still does show all elements of the complete set. This way, the chart does not show the elements that do not exist and creates ‘discontinuous lines’ (in your case, the lines to ‘0’ would be gone). 
 

Created a generic example (attached as zip) that displays 2 values: one that is discontinuous, one that is has values for all elements. 


The Values1 line has an index domain:

Parameter Values1 {
IndexDomain: e | Values1Domain(e);

The graph has a Display Domain set to 1 for Values1


Badge +4

Thank you for the example, Gertjan.

I tried to make the same graph in my model, but unfortunately did not succeed.

I think this has to do with a double index (see below). I cannot get rid of it. Could this have something to do with a different AIMMS version that I am working in (4.71)?


Badge +4

I found the problem with the x-axis and I solved it (I changed the slicing index of the InfoHistory).

Unfortunately, my graph now still looks like in the picture below. 

Do you have any idea what I forgot?

The sets and parameters are exact copies of the ones in your model, and I believe I also set all the chart parameters the same.


Userlevel 6
Badge +6

Hi @Brn 

This option was introduced in 4.74, see:

https://www.aimms.com/support/new-features/#MisLin

So suggest you to upgrade. 

Badge +4

Thank you very much, @Gertjan . Is there also a version available where we can connect points with a line if the value(s) in between them is/are missing?


Like in this example:


Userlevel 6
Badge +6

Hi @Brn 

Glad it works! 


Regarding your question, no there is not as it means the interpretation of the line becomes unclear (as if there are values anyway, while there are not); this can become confusing for users. 

If you feel it’s important, you can decide to interpolate between points (build a copy of the current identifier as you do not like to change the original). Of course the interpolation could be a straight line as you suggest In your drawing, but you can also wonder if it should be up-and-down zigzagging, or have some other form. To be honest, I wouldn’t know; this brings me back to the remark above. 
 

Of course, in the end it’s about what the chart should tell the user; how it help him/her to understand results and/or take action. 
 

Of course, open to other ideas about this. 

Reply


Didn't find what you were looking for? Try searching on our documentation pages:

AIMMS Developer & PRO | AIMMS How-To | AIMMS SC Navigator