
To easily recognize data items belonging to the same category, it helps to have:
- a good qualitative color palette, and
- a consistent use of that palette for charts on that page.
This is why I wrote two corresponding How-To articles:
- Add color palettes
This article is about using qualitative color palettes that can be obtained from the internet, and subsequently transcribed to a CSS file that can be used in conjunction with annotations for AIMMS Data Dependent Styling.
This article comes with an AIMMS application that let you transcribe your own palettes. - Consistent data coloring on an AIMMS WebUI page
This article is about using the CSS files created in the first article to obtain a consistent use of the legend for all widgets on that page as shown in the following picture: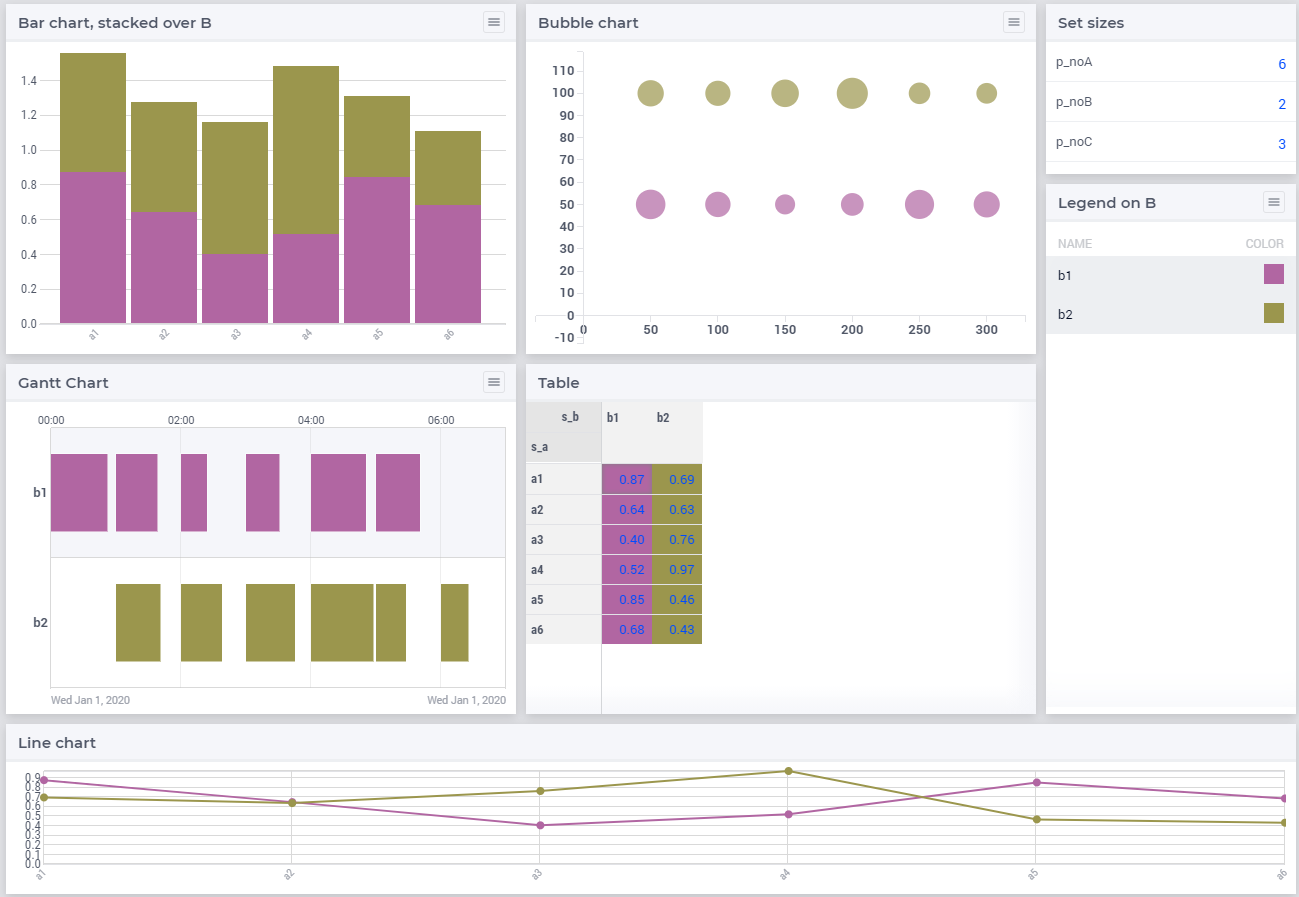
I hope these articles will help you in setting up data visualization palettes for your own application.