Implemented

Control over the frequency of the vertical lines in a Gantt Chart

Related products:WebUI
  • May 24, 2022
  • 7 replies
  • 65 views

Chris Kuip
AIMMSian
Forum|alt.badge.img+7

On behalf of a customer, I forward the following idea:


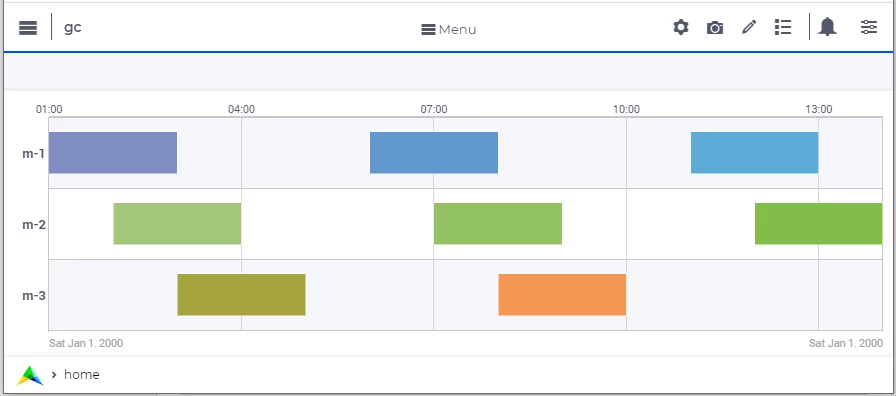
As a model builder, I would like to control the grid resolution in the Gantt Chart.  For instance, in the image below, I would like to draw a vertical grey line every hour, instead of every 3 hours.

WebUI from enclosed AIMMS 4.85 project

The associated AIMMS 4.85 project is attached.


7 replies

Madhu Krishnappa
AIMMSian
Forum|alt.badge.img+5
NewOn Backlog

gabiservidone
Administrator
Forum|alt.badge.img+6
Idea merged into:

All the votes from this idea have been transferred.

gabiservidone
Administrator
Forum|alt.badge.img+6
The following idea has been merged into this idea:

All the votes have been transferred into this idea.

gabiservidone
Administrator
Forum|alt.badge.img+6
The following idea has been merged into this idea:

All the votes have been transferred into this idea.

Madhu Krishnappa
AIMMSian
Forum|alt.badge.img+5
On BacklogIn Development

Madhu Krishnappa
AIMMSian
Forum|alt.badge.img+5
In DevelopmentImplemented

Madhu Krishnappa
AIMMSian
Forum|alt.badge.img+5

Happy to share that this feature request has been implemented in the newly revamped Gantt Chart widget type (GanttChart v2) released in AIMMS WebUI 25.8.

For details on customizing the X-axis intervals in the Gantt chart, please refer to the documentation.


Thanks,
Madhu Krishnappa

AIMMS WebUI Product Owner


Didn't find what you were looking for? Try searching on our documentation pages:

AIMMS Developer & PRO | AIMMS How-To | AIMMS SC Navigator