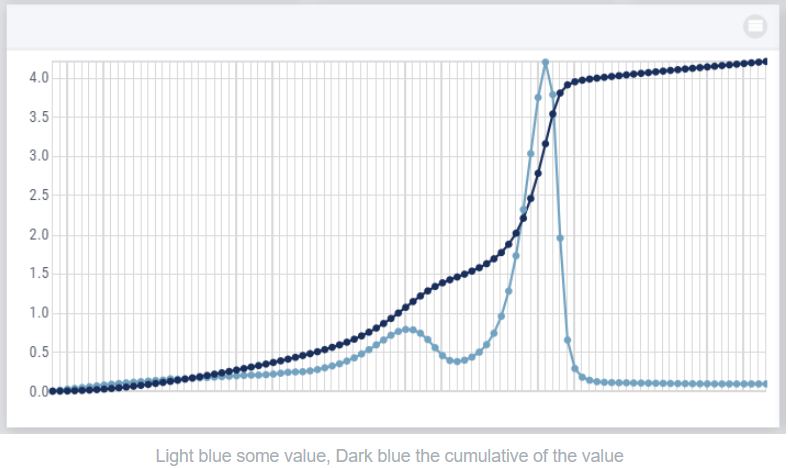
In the graph below there are apparently too many values in the graph to show the corresponding xticks properly, so AIMMS hides them.
Instead, I would expect that the scaling is adjusted and I would see fewer x ticks, but at least the minimum and maximum and some ticks in between.
So can the default x ticks be such that something reasonable is shown instead of no ticks at all?