In several of our planning applications (currently built in AIMMS WinUI, discussion ongoing to rebuild them in WebUI), we have resources which can perform multiple tasks at once, and the planner needs to have a good overview of which tasks those resources are doing.
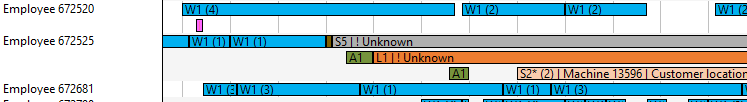
In the WinUI, these tasks are shown on separate ‘lines’ in the Gantt chart (all belonging to the same resource, see first screenshot below) so it is possible to quickly get an overview of them all, read the text in the bar, easily click on or hover over a specific one, and approximately judge how many there are in parallel.
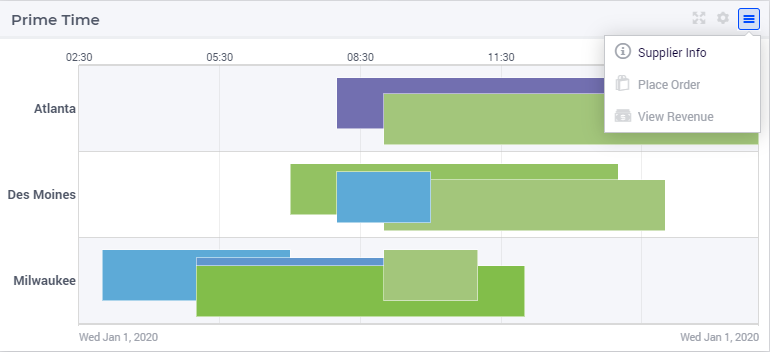
In the WebUI, these tasks overlap (see second screenshot below, from the documentation), making the above much harder or even impossible.
Would it be possible to change this, or add a setting such that the user can select whether he/she wants the bars to overlap or not?
Thanks!
WinUI:
WebUI: