

In this guide, we’ll show you how to make the most of Power BI embedded in SC Navigator. After running different scenarios in SC Navigator, you can take the results and turn them into interactive visuals and dashboards. This lets you explore your data in new ways, highlight the insights that matter most, and easily share them with your team.
The first step is to run your scenarios. After setting up the configurations, simply click the Optimize button to generate results. Take a moment to review the output, and once you’re happy with it, save the scenario so you can use it later in Power BI.
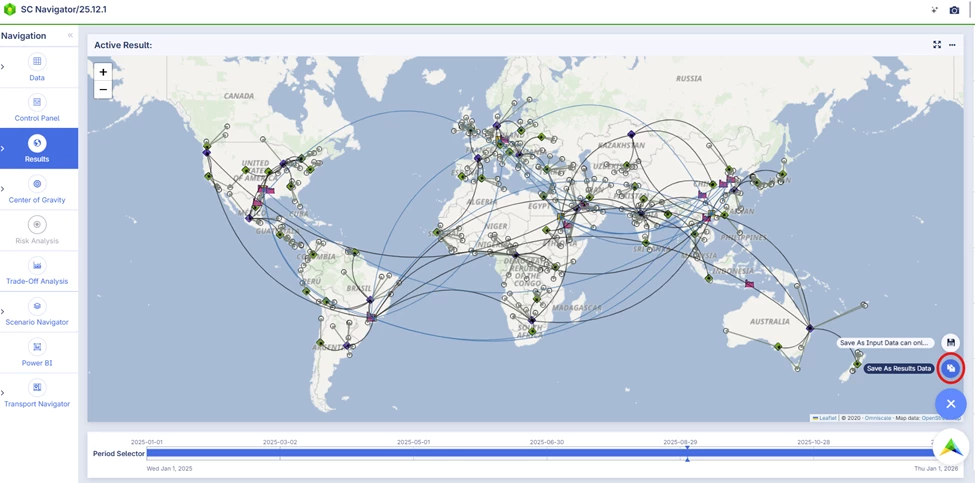
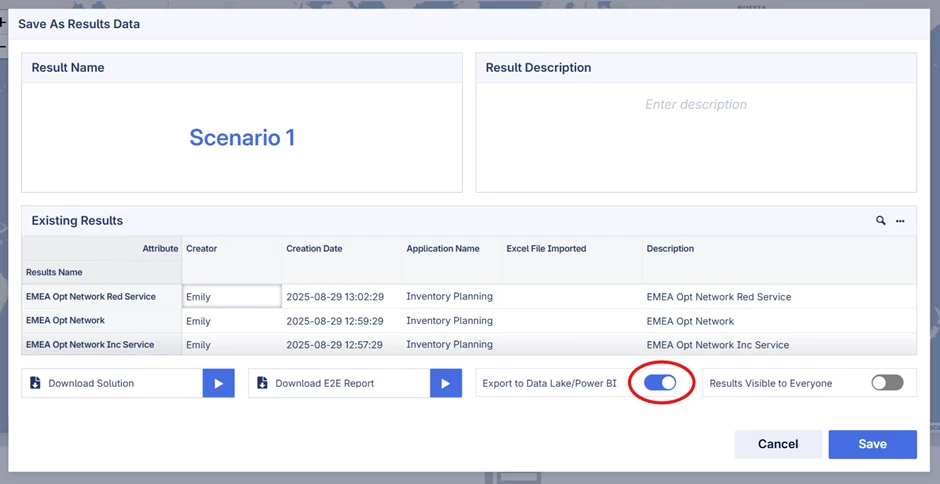
On this page, you’ll find an option to export the results to Data Lake/Power BI. Simply switch it on. From now on, whenever you save a scenario this way, the results will automatically be available in Power BI Embedded, ready for you to start modelling and building your dashboards.
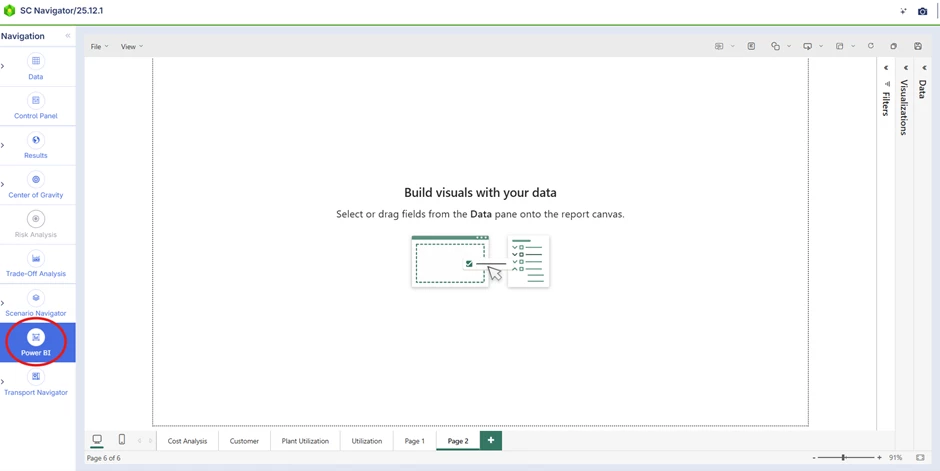
Next, go to the Power BI Embedded page, where you’ll be able to access your saved scenario results and start turning them into reports and dashboards.
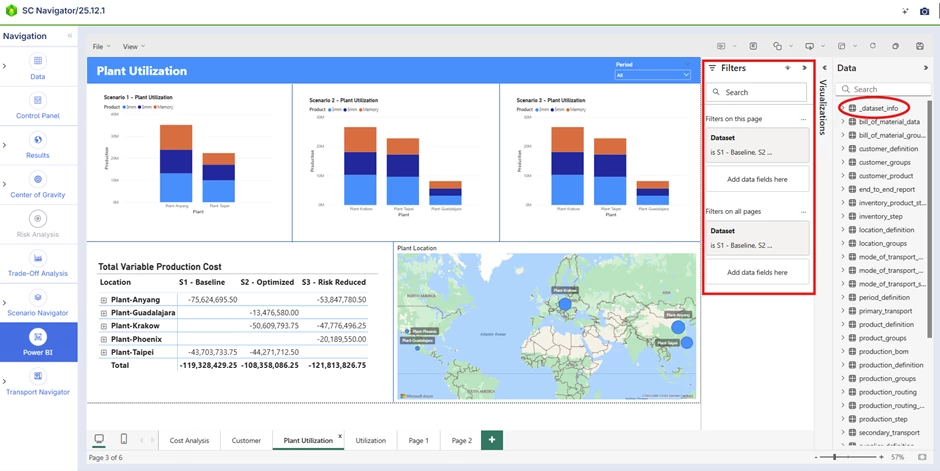
On the right-hand side, you’ll see a data table. This table shows the same information you’d get if you exported the full solution to Excel—it’s just available here directly in Power BI for easier access.
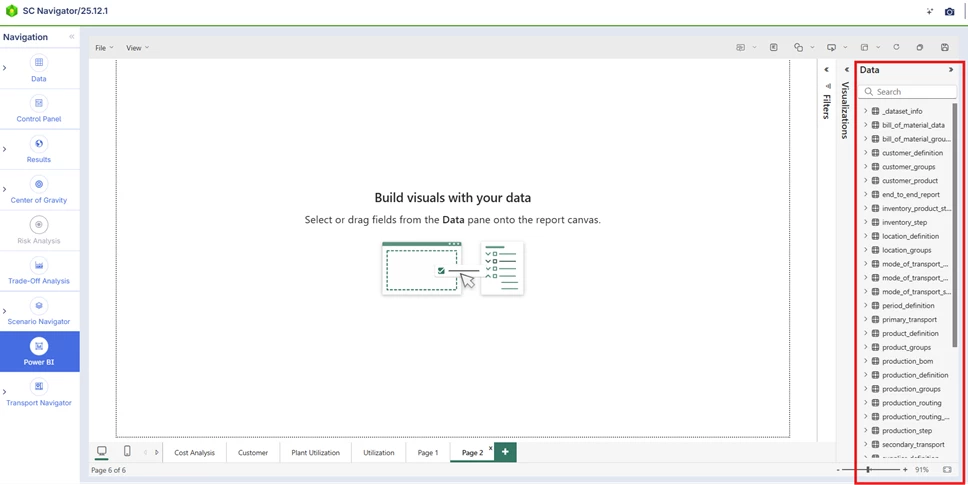
With the dataset key, you can easily filter the scenario results you want to focus on. You can apply this filter across the entire page or just to a specific chart or visual by using the filter panel.
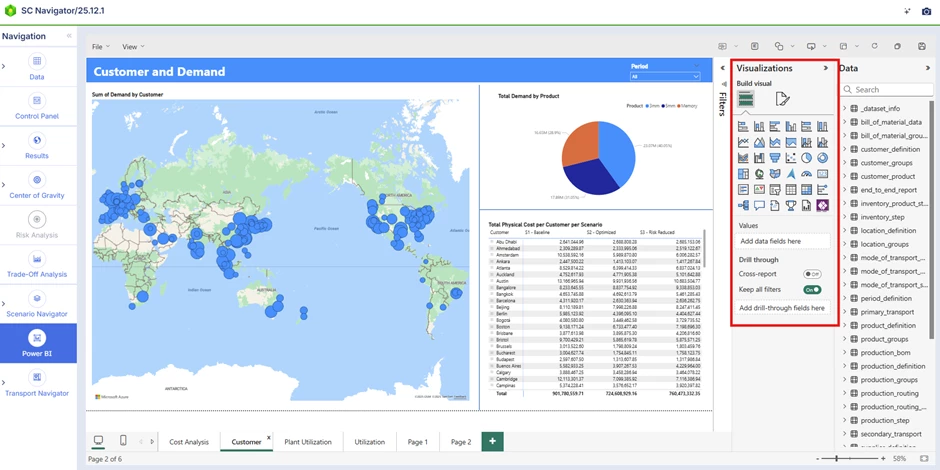
Use the visualization panel to choose from a variety of standard Power BI visuals, making it easy to build and customize your dashboard exactly the way you want.
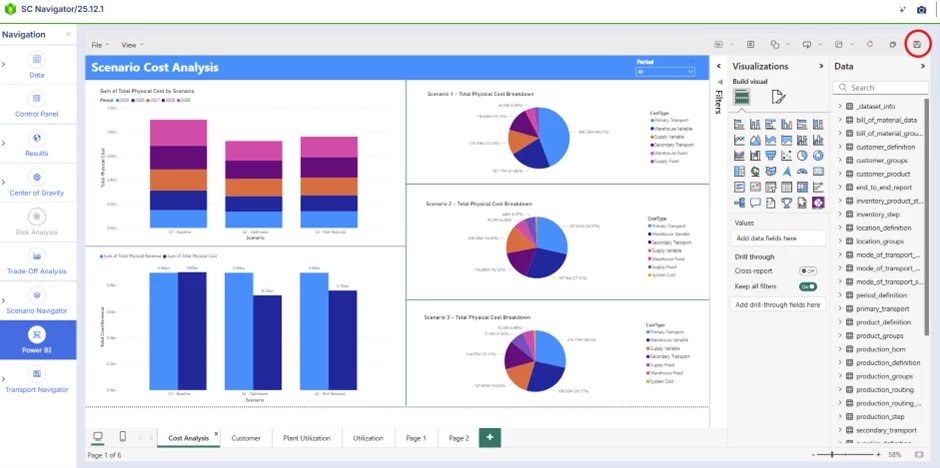
Don’t forget to save your visuals by clicking the floppy disk icon in the top-right corner. Keep in mind that if you navigate to another page without saving, any changes you’ve made will be lost.
You’re now all set to start creating your own custom visuals and dashboards in this Power BI environment.