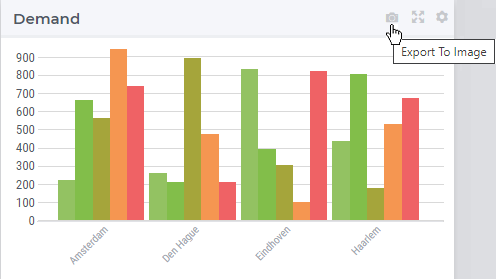
As a end user (role) I need the ability to export graphics as images or pdf documents (functionality) , so I can make a presentation with the results of optimization (goal).
Graphs refer to the following WebUI widgets:
- Bar Chart Widget
- Bar-Line Chart Widget
- Bubble Chart Widget
- Gantt Chart Widget
- Line Chart Widget
- Pie Chart Widget
- Tree Map Widget
Current workflow:
Key widgets defined by end users are duplicated in WinUI and exported to pdf using standard AIMMS functionality bound to widget action or screenshots are taken.
Looking forward to discuss this topic!