Solved

Can't understand the coloring of bar chart in webui

  • 17 October 2023
  • 3 replies
  • 52 views

Userlevel 5
Badge +7

I am trying to understand if I am running into a bug or intended behavior in the coloring of the bar chart widget….


I have three sets:

  • StoragePositions
  • Days
  • Products

I have a parameter supply that is defined over these three sets

Furthermore, I have a an element parameter that allows me to select a specific storage position in the GUI.


If the supply is only provided for one product, the bars in the widget show different colors (which is NOT what I would expect, because I set  the product index in the grouped, or stacked, same behavior) part of the pivot in the widget settings:


If there is one more other product during the time horizon with a non-zero supply value, the colors are indeed calculated per product instead of every bar having its own:


This is the coloring I would expect (and in the first image I would expect all of the 5 bars to be of the same color).


Is there something I am missing in my own logic or is this a bug in the coloring within AIMMS?


Attached the small demo project that shows the behavior. Running this with AIMMS 4.96.9.3 at the moment

icon

Best answer by Koos Heerink 18 October 2023, 11:12

View original

3 replies

Coloring, in (most) widgets, is using the ordinal numbers of the associated set elements of one specific index that plays a role in the widget. This is done by adding CSS classes like 'Mod16Ord5' (for set elements with ordinal number 5, 21, ..etc.) which are mapped to colors by the CSS color palette that is being used.

The bar chart uses a built-in, hardcoded heuristic to select this so-called 'color index'. The gist of this heuristic is: the color-index is

  1. the last index in the 'grouped' part (if any, and if the cardinality of entries in the 'grouped' part > 1), else
  2. the last index in the 'stacked' part (if any, and if the cardinality of entries in the 'stacked' part > 1). else
  3. the last index in the 'header' part (if any)

The reason we added the ‘if the cardinality of entries in the ‘...’ part > 1’ condition, is that in this case the color is not being used to differentiate the data being shown (on of the reasons people are using colors in charts in the first place), and we can probably find better use of the use of colors in the chart.

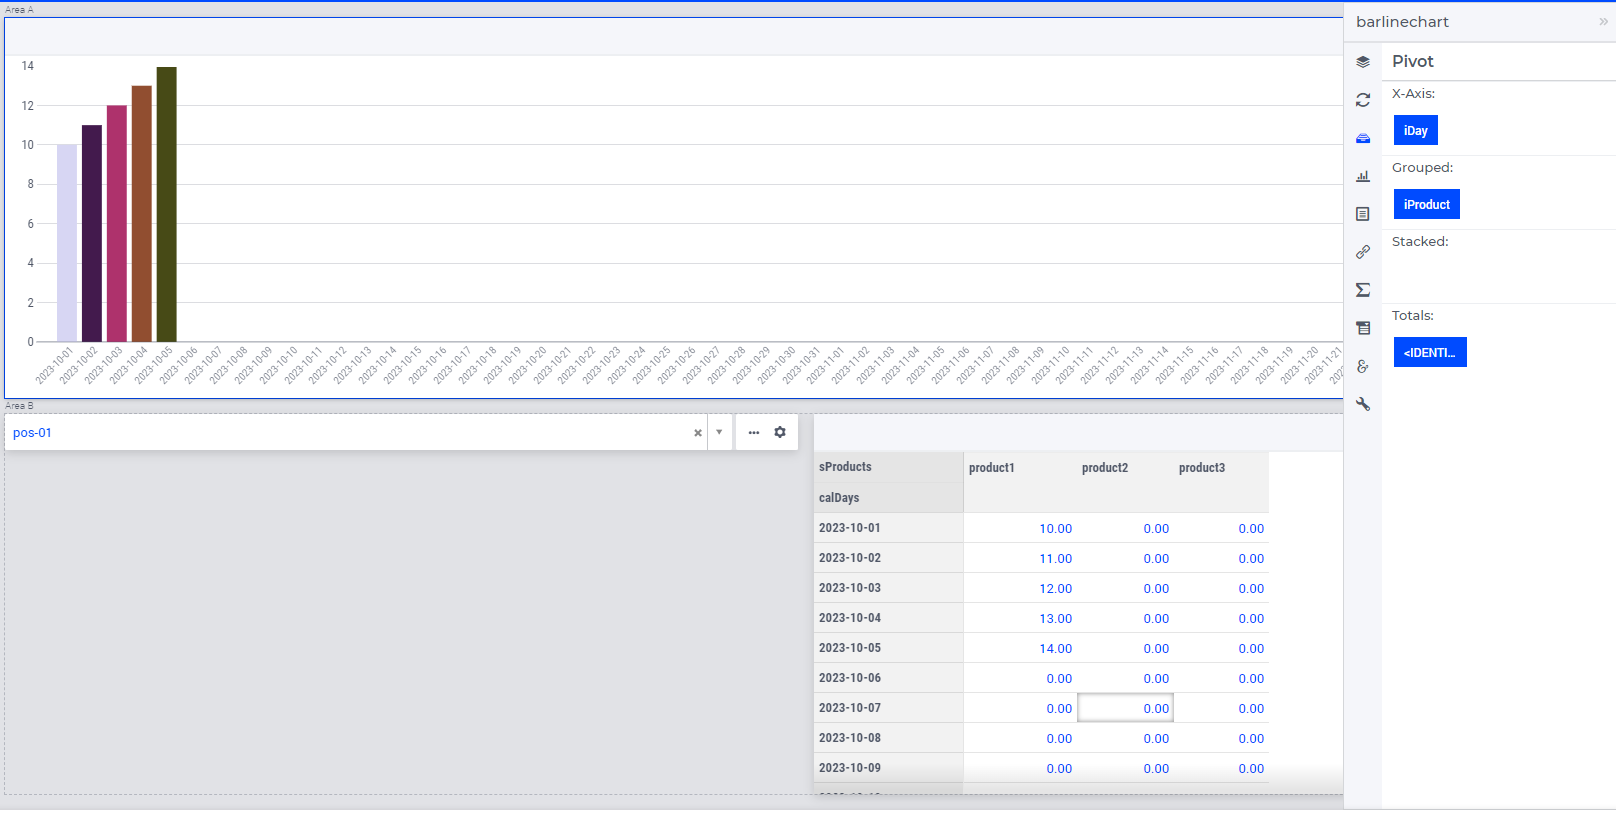
Btw, adding a 'fixed-element' or 'element-parameter' slice will effectively remove the associated index from a widget. As a result this index will not be used to determine the color anymore. In your example, this happens for the 'iStoragePosition' index.

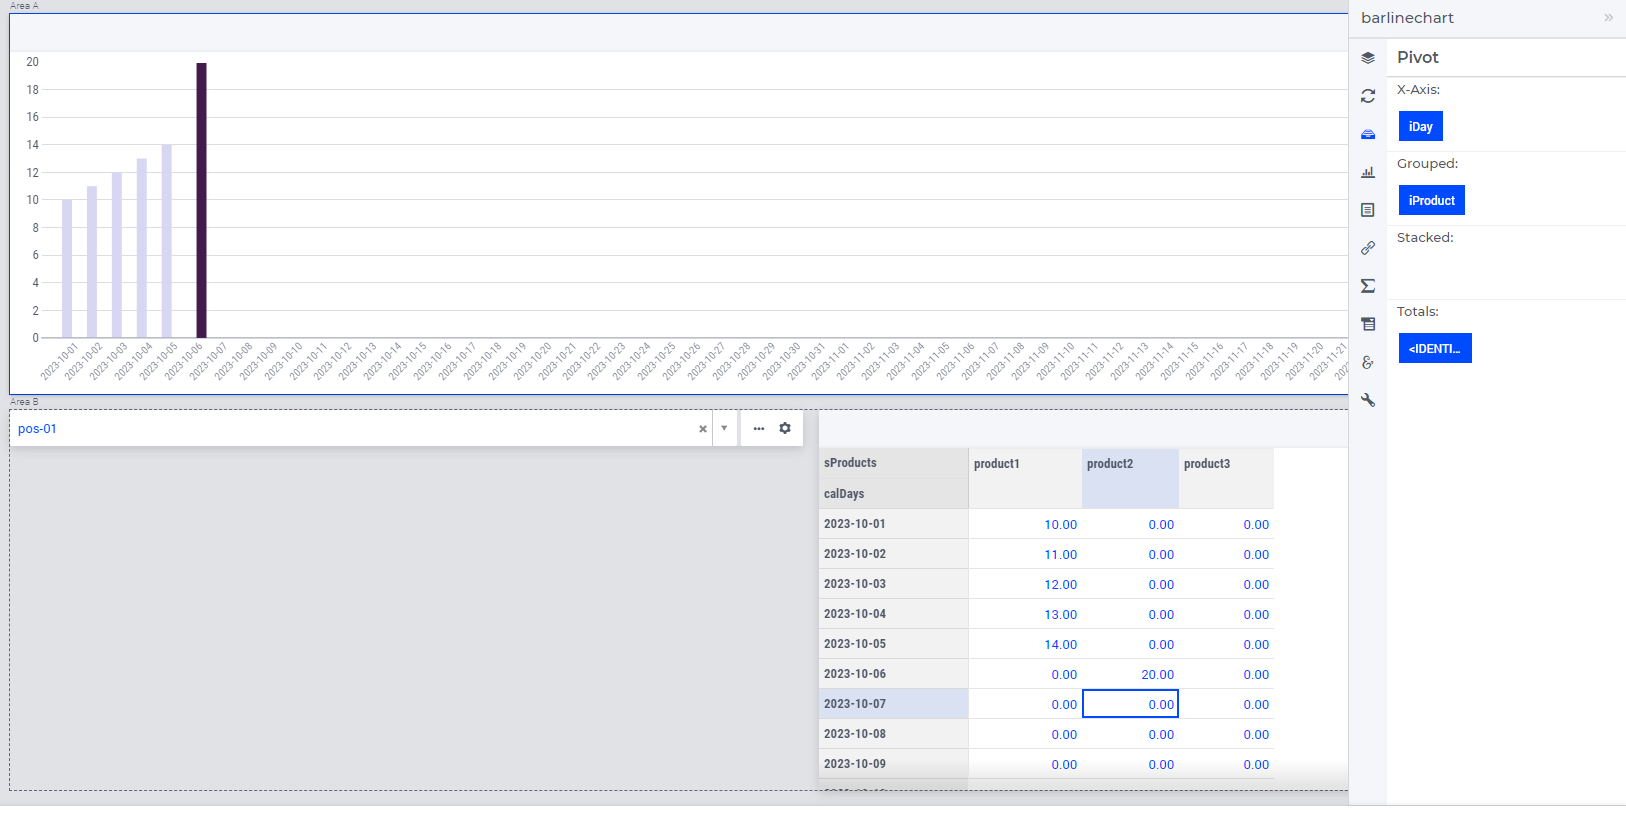
In your example, because the widget is communicating sparse data, the widget is only seeing a single product that contains (non-default) data, as a result of which the 'iDay' index on the X-Axis is being used to color. Long story short, I would say the observed behavior is as intended (and not a bug).

In case you would set the display domain to 1, the widget will observe 3 products and the 'iProduct' index will again be used to color. However, this will have some less nice side-effects on the width of the bars being drawn.

We do realize that the built-in, hardcoded heuristic will probably not lead to the desired coloring in all use-cases. In case you want colors other than provided by the built-in, hardcoded heuristic described above, I would recommend, for now, to add some custom annotations.

In the combination chart we added an option that allows the app developer to explicitly specify the color-index, thereby allowing you to have more control over how the widget colors the elements in the chart. Once the color-index is extended to the bar chart widget too, you will be able to use that too.

Hope this helps!

Userlevel 5
Badge +7

Thanks Koos for this very clear answer. It does make sense when you understand the heuristics being used 😉 Really hope that it will be possible to have more detailed control over this with the color index later on.


Some small follow-up questions I have based on your answer:

  • You mention extending the color-index to the bar chart widget, are there any timelines known for when this is planned to be implemented?
  • Using the full-dense mode (using value 1 for the domain) in theory might be an option, but indeed has a negative effect on the grouped width
  • If I want to implement it myself at the moment, can I use the Mod16ord5 style myself with the annotations. How difficult is it to modify my example application to create an annotation that would make sure the color of a bar would solely be based on the value of the product index?


Hi Guido,

I will leave your 1st question for our PO (product owner) to answer. The answer to your last question is easy: I would not recommend to have your own ‘Mod16Ord5’ style annotation (as this might interfere with classes that the widget itself also adds to certain DOM elements). Instead, I would add a new string parameter to your model and use that as the ‘annotations identifier’

Parameter pSupply {
    IndexDomain: (iStoragePosition,iDay,iProduct);
    InitialData: {
        data 
        { ( pos-01, 2023-10-01, product1 ) : 10,  ( pos-01, 2023-10-02, product1 ) : 11,  ( pos-01, 2023-10-03, product1 ) : 12,
          ( pos-01, 2023-10-04, product1 ) : 13,  ( pos-01, 2023-10-05, product1 ) : 14 }
    }
    webui::AnnotationsIdentifier: ProductAnnotation( iProduct );
}
StringParameter ProductAnnotation {
    IndexDomain: iProduct;
    Definition: FormatString("custom-%e",iProduct);
}

This will add a class like ‘annotation-custom-product1’ to all bars in your chart, which you can then (by adding some custom CSS) use to give all bars the same color.

Reply


Didn't find what you were looking for? Try searching on our documentation pages:

AIMMS Developer & PRO | AIMMS How-To | AIMMS SC Navigator