I have a Gantt chart in WinUI that I'm trying to replicate in WebUI. The bars are colored based on the data (and a small bit of logic). I also have text on the bars.


The only way I can find to make sure the text shows up is change the css. But the text doesn't respond to anything but the stroke property.


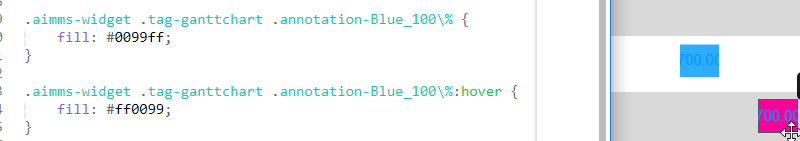
Here's the css, and below is the result:


code:
.aimms-widget .tag-ganttchart .annotation-Red_100\% {
stroke: black;
fill: rgb(255,50,50);
}

.aimms-widget .tag-ganttchart .annotation-Green_100\% {
stroke: white;
fill: rgb(50,255,50);
}

.aimms-widget .tag-ganttchart .annotation-Blue_100\% {
stroke: white;
fill: rgb(50,50,255);
}

.aimms-widget .tag-ganttchart .annotation-Orange_100\% {
stroke: black;
fill: rgb(255,153,50);
}


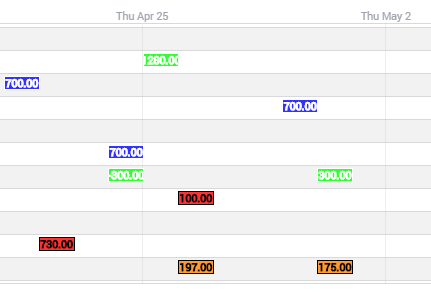
Is there any other way to change the text without also having the stroke around the bar change?


Thanks!

~Bon
More information on the font color situation...


The fill property fills both the bar and the text, BUT when you hover, it only fills the bar (and not the text):


Hi @MathFour


We're currently looking into this and will get back with more information as soon as we can!
Hi @MathFour ,


We use

.aimms-widget .tag-ganttchart .bar.annotation-Red {

stroke: (for border)

fill: (for background)

}


.aimms-widget .tag-ganttchart .label.annotation-Red {

fill: (for text color)

}


Maybe that helps?

Reply


Didn't find what you were looking for? Try searching on our documentation pages:

AIMMS Developer & PRO | AIMMS How-To | AIMMS SC Navigator