Solved

Is there an equivalent/alternative in WebUI for the indexed page in WinUI?


Hi,
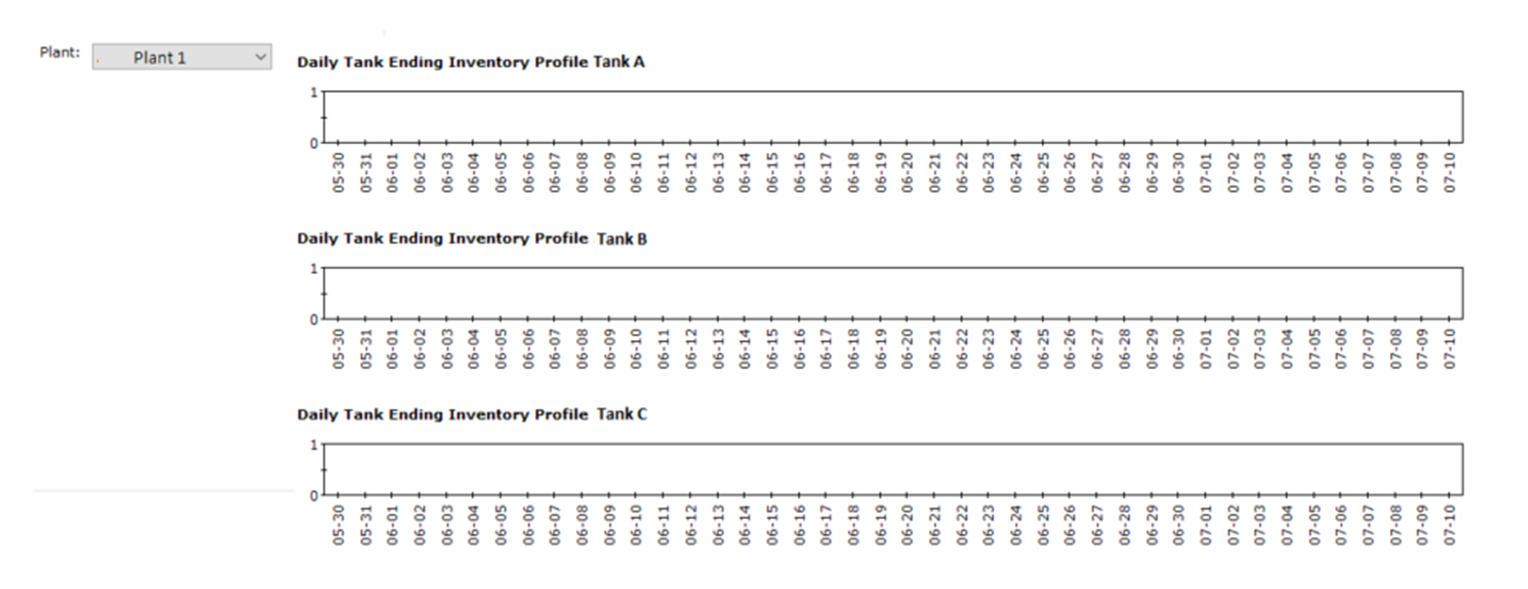
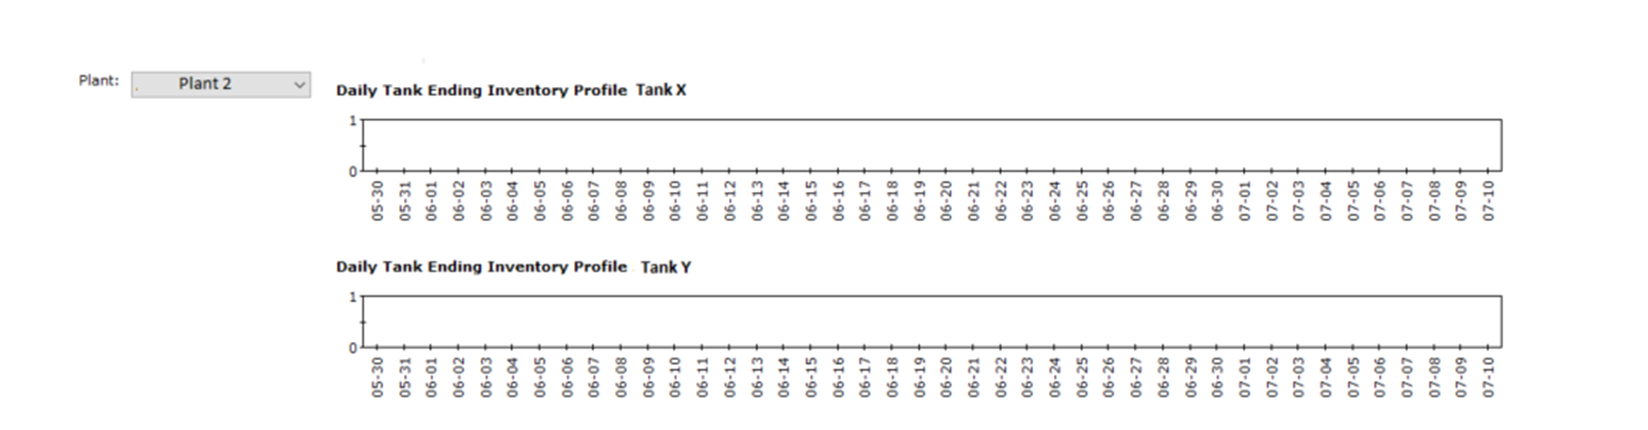
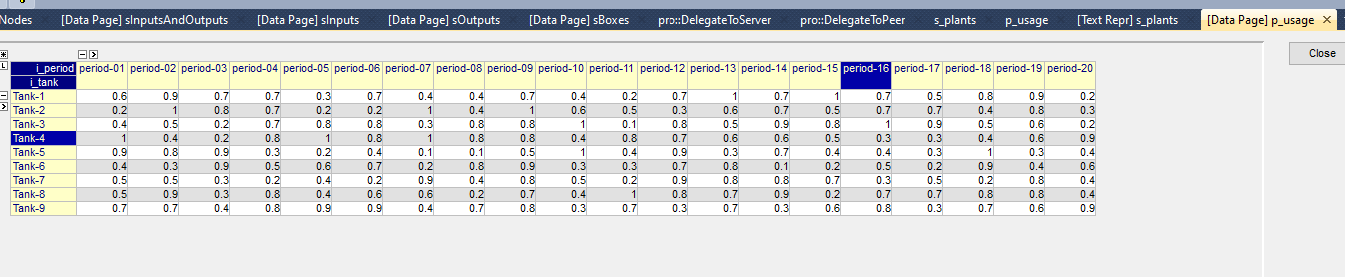
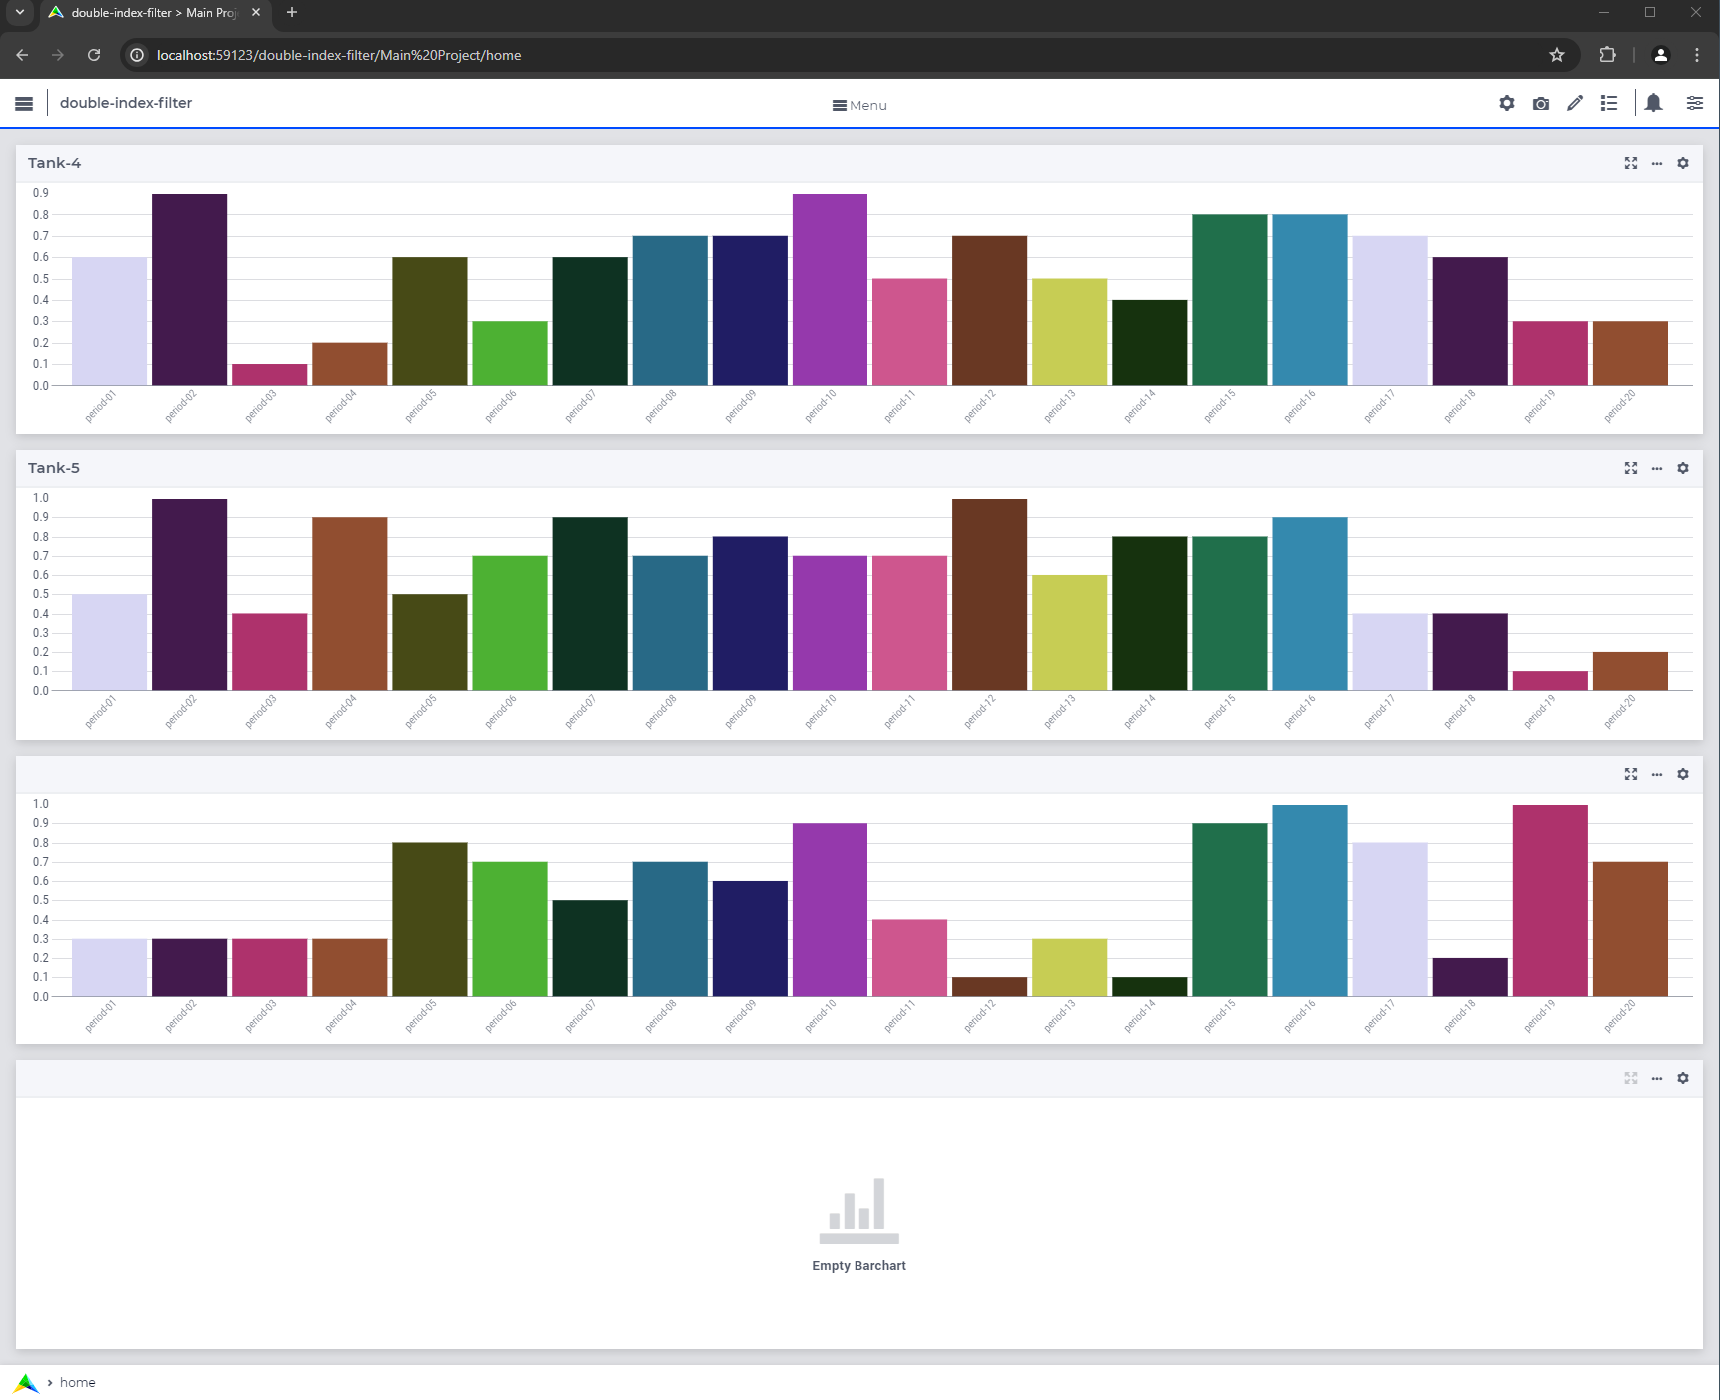
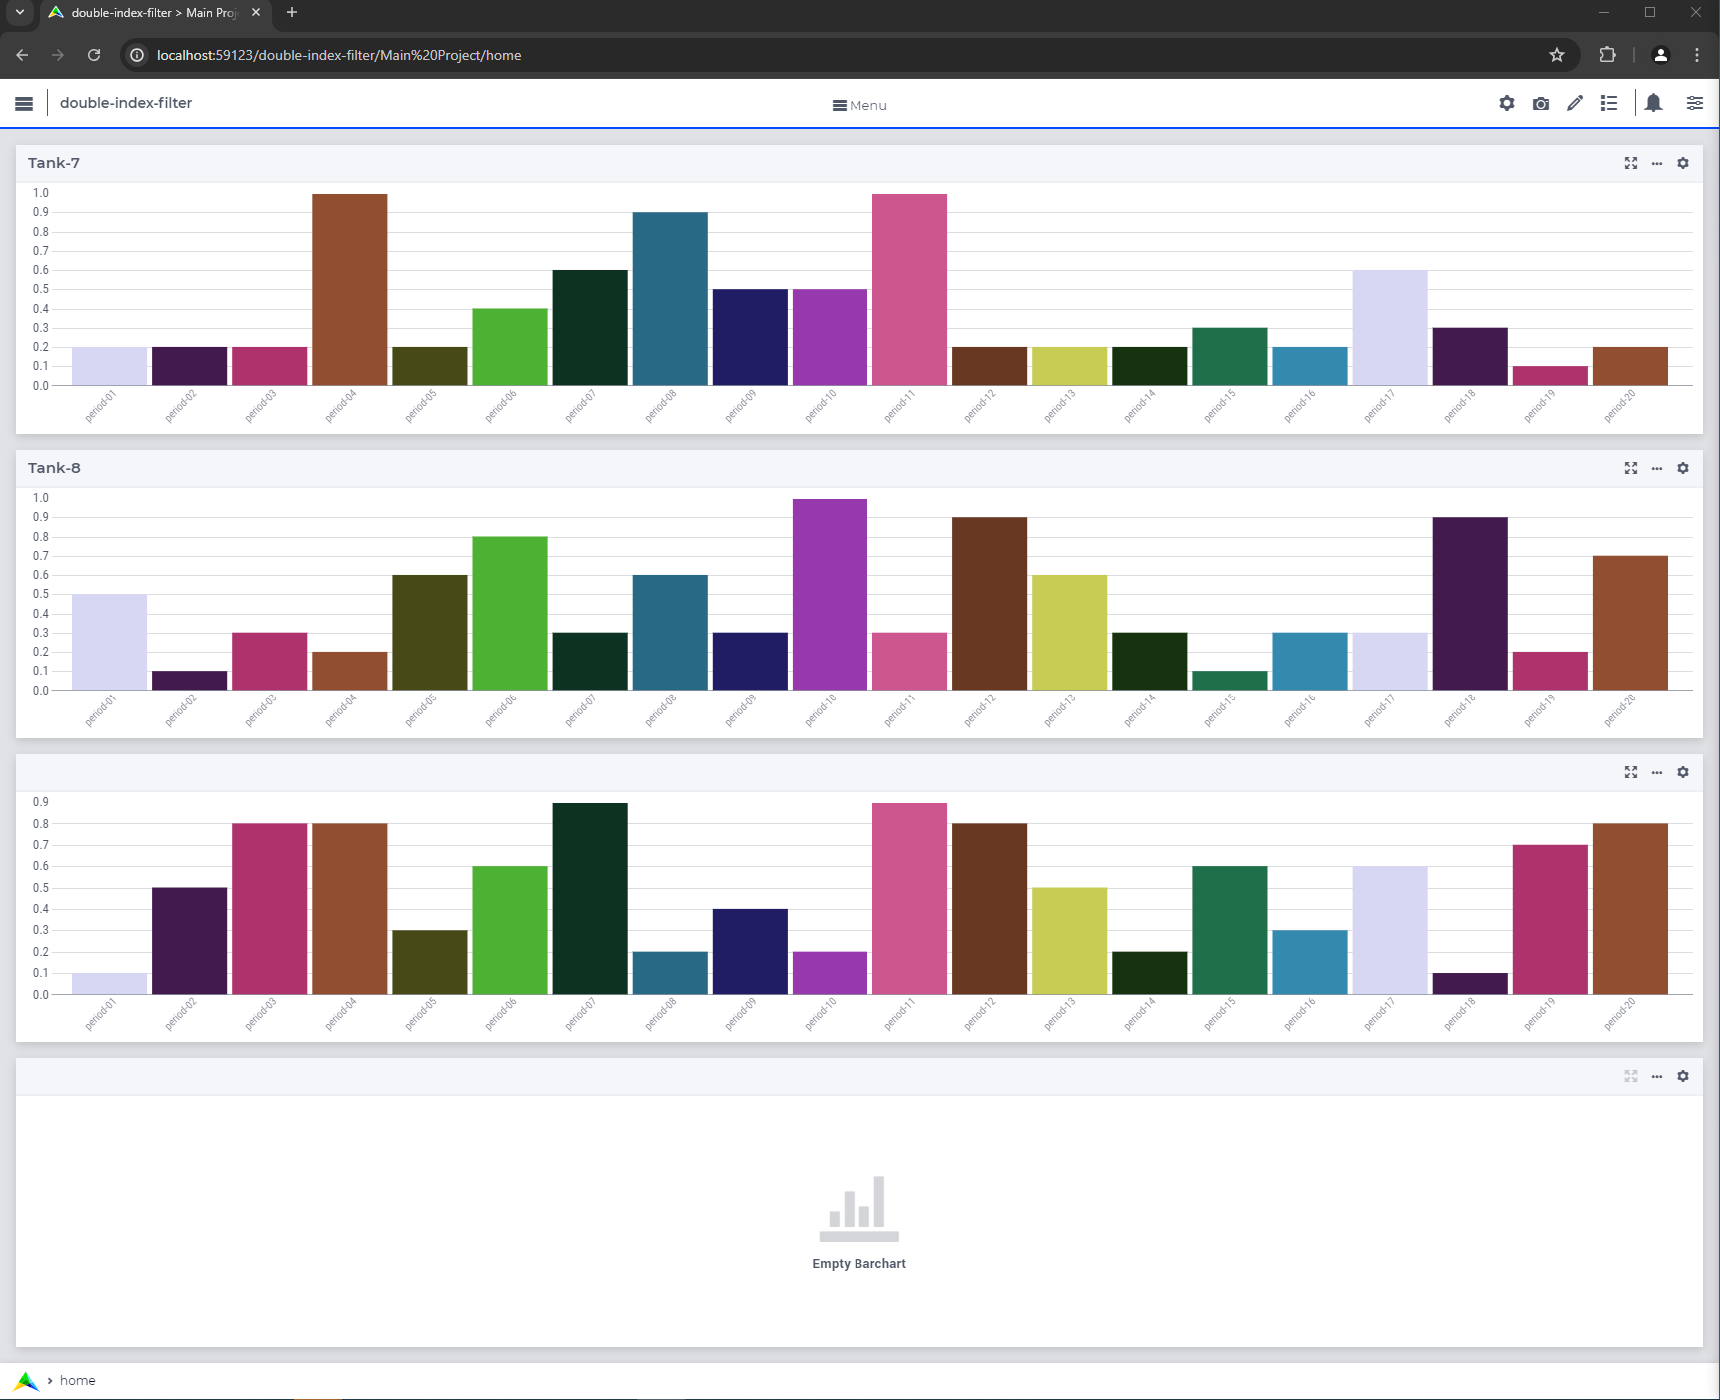
In my case, each plant has a different set of tanks, and the user is able to select one plant at a time. Whenever user selects a plant, the inventory level over time for each tank in the plant is shown on a graph - and the graphs need to be placed on top of each other.


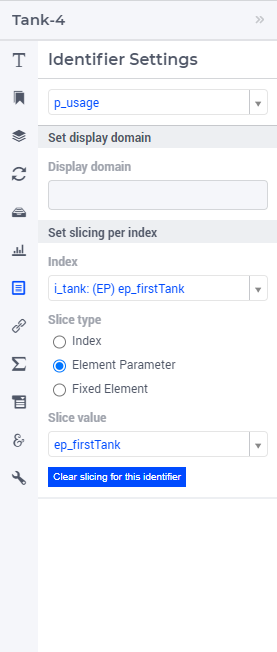
This was a behavior that could be achieved in WinUI easily, by creating an Indexed Page object and identifying a parameter for the Index Rows. 


I am wondering if there is a way to achieve the same behavior within WebUI?

11 replies

Userlevel 5
Badge +6

Hello Gorkem,


The Tabbed widget and the Named views come to mind:

https://documentation.aimms.com/webui/webui/tabbed-widget.html

They can allow you to switch (programmatically, if you like) between the tab.

https://documentation.aimms.com/webui/webui/widget-options.html#widget-named-views

This allows you to switch between widgets (types, data, etc.).


I am not sure what you mean by "the graphs need to be placed on top of each other.”.

Can you share more on this?


Thanks!

Userlevel 1
Badge +3

Hi @luispinto,

Sorry for the ambiguity. I meant the data for each tank should be shown on a separate graph in a row-wise layout. For example, let’s say Plant 1 has Tanks A, B, and C, and Plant 2 has Tanks X and Y. Then, if I choose Plant 1 I will see the graphs for its tanks as below.

If I switch to Plant 2 then I will see the graphs for Tanks X and Y.
 

As such, we have lots of plants with different number of tanks. Indexed Page in WinUI had the behavior above -- when you switch between plants, it automatically shows a separate graph for each tank of the selected plant on the same page.


I couldn’t experiment with Tabbed widget as it requires higher version than I am currently using, but none of those you mentioned seem to replicate this behavior, unfortunately.

Userlevel 3
Badge +5

Hi @gorkem

I encourage you to try using the new Tabbed widget.

See the demo video below: I create one WebUI page for each of the plants and add the required charts for that plant. On the main page, I added a selection box to choose between the plants. Beneath this selection box, I add the Tabbed widget, where each tab is associated with a plant page.

To avoid showing all the tab headers upfront, I hide them using the widget's settings. Based on the selected plant, I set the appropriate tab to be selected. For example, when Plant A is selected in the SelectionBox, the tab associated with Plant A's page is shown along with its widgets. Similarly, if Plant B is selected, the tab for Plant B's page is displayed with its associated widgets.

I hope this helped.

Thanks,
Madhu Krishnappa
AIMMS WebUI Product Owner

Userlevel 1
Badge +3

Hi @Madhu Krishnappa,

Thanks for the video, much appreciated. I understand the logic and can see why it would work, but I’m concerned about the practicality and maintenance here.

Consider having 200 plants and 600 tanks in total, which is very close the real situation we are facing. If I understood correctly this solution would require creating 200 pages and 600 widgets. Moreover, whenever a new plant is added to the system, it would require creating another dedicated page to it and modifying the source code accordingly.


On the other hand, with Indexed Page within WinUI, this requires solely creating one simple Indexed Page object and only one chart no matter how many plants or tanks you have. It would take about 10 mins at most and after that it would require no maintenance at all regardless of the addition of new plants or tanks.

It’d be great to have such functionality within WebUI as well.

Thanks,

Gorkem


Userlevel 5
Badge +6

Hello @gorkem 


If I understand correctly, you have a link between the plants and the tanks.

My initial impression would be that you need an element parameter in a selection widget to choose which plant you want and then a subset of tanks that are selected based on this element parameter.

In the widget that you would display the information you would use the subset of tanks and only show those that make sense.

This would not require any Tabbed page since you are only filtering towards the specific set of tanks.

Does it make sense?

Best regards

Userlevel 1
Badge +3

 Hi @luispinto 

My initial impression would be that you need an element parameter in a selection widget to choose which plant you want and then a subset of tanks that are selected based on this element parameter.

Yes, That’s how we do it currently in our current AIMMS model that runs WinUI. With a selection box we assign the selected plant to an element parameter, say ep_SelectedPlant, then a set, say s_FilteredPlantTanks, that is a subset of all tanks keeps only the tanks of the selected plant.

The set s_FilteredPlantTanks also has its own parameter ep_FilteredPlantTanks which keeps the tanks of the selected plant and Indexed Page object uses this ep_FilteredPlantTanks, and show each tank’s graph seperately.


In the widget that you would display the information you would use the subset of tanks and only show those that make sense.

Correct.


This would not require any Tabbed page since you are only filtering towards the specific set of tanks.

Correct. However, correct me if I’m wrong but I still don’t see any solution to this within WebUI other than creating all the graphs for 600 tanks and then showing only the related ones, which would require maintenance and huge time effort. 

On the other hand, the key point with Indexed Page object is, you create only one graph, and then it populates the graphs of filtered tanks automatically for you.

Best,

Gorkem

Userlevel 5
Badge +6

Hi @gorkem 

I think I am starting to understand your challenge. Is this because you need/want 1 separate bar chart per tank and not all of them in a single chart?

This is how I did it. I first created the following structures in AIMMS to represent the problem and data:


Set s_plants {
    Index: i_plant;
    Definition: {
        ElementRange(
            From    :  1, 
            To      :  3, 
            Incr    :  1, 
            Prefix  :  "Plant-");
    }
}


Set s_tanks {
    Index: i_tank;
    Definition: {
        ElementRange(
            From    :  1, 
            To      :  9, 
            Incr    :  1, 
            Prefix  :  "Tank-");
    }
}


ElementParameter ep_tanksPlant {
    IndexDomain: i_tank;
    Range: s_plants;
    Definition: nth(i_plant, ceil(ord(i_tank)/card(i_plant)));
}


Set s_periods {
    Index: i_period;
    Definition: {
        ElementRange(
            From    :  1, 
            To      :  20, 
            Incr    :  1, 
            Prefix  :  "period-");
    }
}


Parameter p_usage {
    IndexDomain: (i_tank,i_period);
    Definition: round(uniform(0,1),1);
}


Which gives the following parameter that I want to show in a graph:


I added additional identifiers to select, filter tanks and identify which tanks I wish to display. In this case I will display a maximum of 4 tanks on the page:

ElementParameter ep_selectedPlant {
Range: s_plants;
}


Set s_selectedTanks {
SubsetOf: s_tanks;
Index: i_selectedTank;
Definition: {
{i_tank | ep_tanksPlant(i_tank) = ep_selectedPlant}
}
}


ElementParameter ep_firstTank {
Range: s_selectedTanks;
Definition: Nth(i_selectedTank, 1);
}


StringParameter sp_firstTank {
Definition: ep_firstTank;
}


ElementParameter ep_secondTank {
Range: s_selectedTanks;
Definition: Nth(i_selectedTank, 2);
}


StringParameter sp_secondTank {
Definition: ep_secondTank;
}


ElementParameter ep_thirdTank {
Range: s_selectedTanks;
Definition: Nth(i_selectedTank, 3);
}


StringParameter sp_thirdTank {
Definition: ep_thirdTank;
}


ElementParameter ep_forthTank {
Range: s_selectedTanks;
Definition: Nth(i_selectedTank, 4);
}


StringParameter sp_forthTank {
Definition: ep_forthTank;
}


In WebUI page I created 4 bar chart widgets and adjusted the page display to "Layout11”.

I then added the p_usage(i_tank,i_period) in the bar chart and used the slicing to use ep_firstTank for the first widget, etc.


And also for the title, using the sp_firstTank, etc.


The resulting page has 4 widgets that automatically updated based on the selected plant.

For Plant 2


For Plant 3


This would require you to define the “maximum number of tanks you will have for any plant of course, but it will automatically update based on selection and you do not need.

Some adjustments and thoughts:

  1. You could use the hide feature in WebUI to hide the “Empty Barchart” widgets
  2. You could extend your page display to be longer in height (with a scroll bar) to create a standard height for bar chart and so that they do not change based on the number of tanks.
  3. You could create a “pagination” type solution that allows them to show the first 5 and then the next 5, etc. with some buttons and procedures.
  4. You could provide a filter that allows them to choose which Tanks they want to view and you start by population with the first 5 or so


Does this solve it?

Userlevel 5
Badge +6

Here is the source code if you would like it.

Userlevel 1
Badge +3

That’s great man, thanks a million! I already implemented it.

Is this because you need/want 1 separate bar chart per tank and not all of them in a single chart?

Yes, that was the main challenge and I couldn’t think of using the Nth function which is the game changer here.

I didn’t even need to look at the source code as you explained it so well in your message.

The effort needed to be put in here will be determined by the plant with the maximum number of tanks, but I don’t think this number will be very high (at least much less than the total number of tanks) and thus it’s still a very good solution.

Best,

Gorkem

Userlevel 5
Badge +7

Thanks @luispinto  for this example showing the usage of the nth function. This is now somewhere on the top in my mental toolbox again instead of all kinds of manual workarounds to achieve this!!

Userlevel 5
Badge +6

Glad to have helped @gorkem!

Happy to share the knowledge  @gdiepen  (and surprised I can still teach you some tricks!)

Reply


Didn't find what you were looking for? Try searching on our documentation pages:

AIMMS Developer & PRO | AIMMS How-To | AIMMS SC Navigator