This week I got the following request "Add functionality to 'watch' identifiers and view the data of all those watched items within a window panel".
I did some probing with the requester to better understand the need for this and I learned it would help the developer to debug faster than using various data pages, or see values inline via the debugger.
My thinking at this point is:
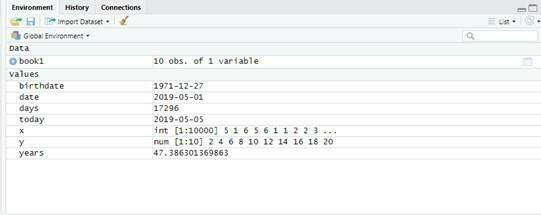
- One would like to be able to watch the identifiers in the Developer IDE (something like you do in R Studio - see picture below)
- One would be able to dive in details of the data via a DataPage option (only first items are shown; like x below in R Studio example)
- One would select identifiers to watch from the model tree (or model) and not necessarily ALL identifiers that are touched (could be an extreme long list)?
Wonder about your thoughts
Watch Window
Sign up
Already have an account? Login
Please use your business or academic e-mail address to register
Login to the community
No account yet? Create an account
Enter your E-mail address. We'll send you an e-mail with instructions to reset your password.


